The periodicity of solar activity and the Earth's climate change cycle repeat at the same time.

This site covers the relationship between solar activity and climate change.

solor-activity-is-repeated.com

See the big perspective

We are not affiliated with any research institute.
We are a unique research team.

http://truth-about-climate-change.jp/

The above link is edited with an emphasis on climate change issues.
This site is edited with an emphasis on solar activity cycles and climate change cycles.


Latest Analysis

Main Cause of Modern Warming

See the data above.
It confirms that the rise in temperature (sun light rise) relative to the rise in solar wind (radiocarbon 14) has lagged behind the rise in solar wind (radiocarbon 14) for about 60 years.

People around the world believed in the Milankovitch cycle theory, but were consequently deceived.

The occurrence of glacial cycles and other cycles are caused by drastic fluctuations in sunlight.

Of course CO2 cannot amplify sunlight.
This will greatly advance the debate on why modern warming was occurring.


Solar Activity(Solarwind) and CO2(Ice core)Data

Almost everyone in the world is mistaken, but sunspot data is only a count of the number of spots and is not the same as the output value of solar activity.
Solar wind variability is an important factor in measuring solar activity output.
As you can see, solar wind variability and CO2 variability are correlated.
Anthropogenic CO2 variability is less than 10% of this total.
Solar activity is the main reason for the fluctuations in CO2 levels, and CO2 has no known chemical reaction that raises ambient temperatures in the first place.

or
Earth's CO2 may be causing solar wind fluctuations.
In that case, the solar wind could be controlled by human CO2 emissions. (Wow!)


NEW

Anyone who ignores solar wind variability data hasn't studied hard enough!


Contents renewed.
September 1, 2022


日本語版ページはこちら

All image data are pasted in high resolution. They are laid out in a reduced size.
If the text is too small to read, you may want to save the data once on your own device.

Purpose of this site

This site will establish the cyclic nature of solar activity.
It will greatly advance humanity's understanding of natural history.
Dedicated to all scientists.

Mogura no Mogu Solar Activity Climate Change Research Project Team

The budget for this research and site operation is independently generated, and no interested organizations exist.

NEW・Climate Change Models


Systematic Model of Temperature Variability (Climate Change)

Organize the data available by searching the Internet in chronological order.
Identify the regression point of the law and prove its periodicity.
That's all it takes to uncover the core facts of natural history.
It is a proof in the common sense.

NEW

Proof of temperature fluctuations cycles (climate change cycles) that may be due to the periodicity of solar activity

https://climateilluminated.com/CO2_facts/carbon_lag/Vostok_800yr_lag_CO2.html

Compare the cycle point of one previous interglacial (140,000 years ago) to the latest interglacial (currently underway).
The modern warming claimed by the IPCC et al. was one of the periodic points.
Let's calm down and study .🙄


Researcher and presenter

Professor Papamogu
Dr. Kaerusan
Professor Papamogu
Dr. Kaerusan

They came from the world of “online picture books mogura-no-mogu.jp” 


mo gu ra no mo gu

They are members of the
Mogura no mogu.com Solar Activity Climate Change Research
Project Team.


SolarWind Cycle Discoverd

Professor Papamogu

Hello everyone.
I'll start the presentation right away.

The existence of sunspot cycles is well known, but the solar wind also has cycles.
We call it the solar wind cycle.
We can show the existence of the solar wind cycle by noticing a large periodicity that is confirmed by natural history.
Asperger's sufferers may find it difficult to understand because of the complex events involved. It would be a good idea to have a sensible person assist you to understand it better.

https://ltrr.arizona.edu/

Data source
Laboratory of Tree-Ring Research (LTRR) at the University of Arizona in Tucson.

Solarwind variation (Solar activity) data for 12,000 years

Very nice data.
This solar wind variability data tells us a lot.


Adapted from Wikipedia.
Temperature variation data from ice cores (Antarctica). Last 450,000 years.


Relationship between solarwind variation (solar activity) data and interglacial periods

I will point out something quite obvious.
Something similar must have occurred in past interglacial periods.

This fact is one piece of evidence that substantiates the concept of the solarwind cycle.

Periodicity model of the Cenozoic Era and solar activity

With this data in front of us, let us imagine.
The prototype of the glacial cycle would have existed about 33 million years ago.
At that time, the prototype of the solarwind cycle shown here would also have existed.

The Mogura no Mogu Model that we present makes sense and can explain many things without difficulty.

Solarwind Cycle Proof and Easy-to-understand Points of View


Elapsed time of each solarwind cycle

First, for beginners.
We will focus on a very straightforward period.
Let's sear through the small levels of the solarwind cycle.

Similarities (i.e., periodicity) of solarwind cycles

Periodicity is hidden here and there in the data in natural history.
We cannot find them if we are too concerned with the details of things.
We can also find this periodicity in solarwind variation data.

Solarwind Cycle Overview (not finalized)

The small levels of the solarwind cycle are currently separated in this way.
The rationale is presented in the following sections.

Solarwind and Sunspots. A.D. 1700 and Beyond

We must realize that the sunspot cycle existed in a way that followed the solarwind cycle.
The solarwind cycle is the primary entity, and the sunspot cycle follows.
Wouldn't that mean that there was a master-servant relationship?


Everyone loves it. Sunspot data, downloaded from SILSO

This familiar data, the number of sunspot observations from 1700 AD to the end of 2019 AD (an average of about 11 years), hid a secret.

In conjunction with the solarwind cycle shown here, there is also a sunspot cycle.

We define "one typical model" as the sunspot observation data from 1700 AD to the end of 2019 AD.
The original pattern of "one typical model" has occurred in the past, hasn't it?

True sunspot cycle (i.e., one set). Shocking fact.

Let me quote this data again.
We have defined this data as "one typical model," but in times of long solarwind cycles, the mean time of sunspots should change.

The solar windcycle is the main phenomenon, and sunspots that occur according to the solar windcycle are not in a free position.

If the solarwind cycle is prolonged, the sunspot cycle should also be prolonged.


Data on the number of sunspots observed since the 17th century

Notice the era called Maunder Minimum.

One possibility. Maunder Minimum and the Solarwind Cycle

The Maunder Minimum is said to be a sunspot-free period, but wasn't it a period when the solarwind cycle was shrinking?
Then, wasn't "one typical model" shrinking along with it?

Hasn't mankind been indifferent to the relationship between the solarwind and sunspots until now?


One possibility: a 12,000 year old solarwind cycle.

Since we do not have detailed data, we cannot make a determination.
However, we will publish this figure as a reference.


Solar wind and sunspot data. Quoted from Wikipedia

This data tells us a lot.


Take a moment to look at the above and below figures and think about them.
Use your imagination.
And use common sense.

We should be aware of the solarwind cycle. Then we will find the truth about sunspots.

Each mountain is different in size.
You can tell by looking at them, can't you?
What does that tell you?
It tells us that sunspot mountains are not always in a 10-year cycle.
More than 20 years have already passed since the beginning of the 21st century. We should not stumble over these things.


NEW

https://nagoya.repo.nii.ac.jp/record/11780/files/KJ00005461828.pdf

Relationship between solarwind cycles and sunspots since 1700 AD; three peaks exist.

Latest Trial
The best study for this trial was published in the past.
Trial 1 is being edited based on the results of that study.


Application. Challenge to prove sunspots in the past.

We immediately applied it.
We estimated a graph of the number of sunspot observations from about 1400 to 1600 AD.


https://tallbloke.files.wordpress.com/2013/10/solar-recon-take2.png

More detailed solarwind variation data for 1200 years (radiocarbon 14)

We also refer to this data in this analysis.


Properly understand Cycle25

Dr. Kaerusan

Nice to meet you. Kero.
(Frog calls in Japanese are “Kero”)

Very interesting things are unfolding at Cycle 25.


Here is the latest data.
Cycle 25 is showing a curious development.
It is very compact.KERO.

Looking back, in Cycle 24, the Sun was changing from a double pole to a quadrupole.KERO.


We cannot explain the phenomenon in this illustration well, but it is a superposition of sunspot observation data separated by 120 years.
We do not know the reason, but there was a period when the data overlapped beautifully.
It ends nicely.KERO.


What if at the end of Cycle 24, the solarwind cycle had switched to a new era?
Cycle 25 will be very different from the "sunspot cycle era of about 10 years" that we know so well.
For example, we may be entering an era of 5-year cycles.
We may even return to the starting point because we have reached the return point of the law.KERO.

In fact, if you look at the SILSO data, it is developing in small increments.
The impression is that something is switching.

Reference, the Solar Cycle25PredictionPanel, an international group of experts, predicts that the 25th cycle's Solar max will be around July 2025.

Soon, which team is the real expert? It will be determined.KERO.


Needless to say, this data was recorded in an era of approximately 10-year sunspot cycles.
If the sunspot period were to become about 5 years, things like this data would also have a 5-year cycle.KERO
Humanity has developed science in the era of sunspot 10-year cycles. If an era of approximately 5-year cycles were to begin, we would be plunging into the unknown.
By comparing solarwind variation data with sunspot data over the past 12,000 years, we can see that such a thing would have happened.KERO.


Latest sunspot observations September 1, 2022


Relationship between solarwind,sunlight,and sunspots

Professor Papamogu

Please see this data again.

Temperature fluctuations in the Earth. And this periodicity. Why is this happening?
In our analysis, the most likely explanation is that the main factor is "Sun light" variability.

In our systematic understanding of things, we find that "sunlight" has changed dramatically over time. And there are great cycles.

Ice core data from the VOSTOK site in Antarctica
And solar wind variation data overlaid.
It is only .....
You can't discuss the entire globe with temperature variation data from one location, but the data from the VOSTOK site can be used as a good reference.

As you can see, the temperature variations at the VOSTOK site do not appear to be perfectly synchronized with the solar wind variations.
The reason for this is that the sun light fluctuations may be occurring on a different dimension than the solar wind fluctuations.

If the solar wind fluctuation precedes the solar wind fluctuation and the sunlight fluctuates a little later, it can be explained.

NEW

We have not seen any discussion of the relationship between solarwind and sunlight to begin with.
But such a discussion is absolutely necessary.
What We have shown here is at a rudimentary level, but it would be a great first step for humanity.


Logical structure of solar activity

In this figure, the level of the sunspot component has been reduced, but in reality, solar wind data alone is not enough to make a study worthwhile.
All factors are important in terms of research value. This figure is only a logical structure in activity.


The impression is that solarwind fluctuates actively.
In comparison, sunlight seems to fluctuate slowly.
This fact must be a relief for life on earth.


The key point to note is that solar wind and sunlight are evaluated in terms of intensity of output.
Sunspots are counted visually. It should not be treated as an indicator of solar activity output.

best to recover from this.


The existing understanding is childish. Specifically, the situation is this.

This may come as a mental shock, but this is the reality.
If our basic and elementary understanding of solar activity is this childish, we will never be able to move forward.


The key point to note is that solar wind and sunlight are evaluated in terms of intensity of output.
Sunspots are counted visually. It should not be treated as an indicator of solar activity output.

What is causing this periodicity in temperature fluctuations?

I don't think solar wind variability is the main cause.
I don't think sunspots are causing it.
If sun light were the main cause, there would be a reasonable explanation.
Then the above data should be called "sun light cycle data".

Radiocarbon14 accumulated within the annual rings of trees, which is an indicator of solar wind variability.

Then what is the oxygen18 in the fossil brachiopods an indicator of? It should be an indicator of sun light variability.

Please see this data again.
This data is of rather rough quality, however, it is nonetheless imaginative.
The difference between the two graphs is what sears the basic facts that have been missing in our understanding of science to date.
If you are the kind of person who can lose sleep over these data, then you have the aptitude for research in the field of climate change.


Impacts in the Solar System

Dr. Kaerusan

I'm going to state something quite obvious. KERO.

The fact that sunlight fluctuates periodically means that temperature fluctuations must be occurring at the same time near the surface of objects (planets, etc.) in the solar system.KERO.


Effects of SolarWind on the Earth's Climate

Professor Papamogu

Quote.
Abnormal Weather: Will the Tenmei Anomaly Return?
Author: Hideo Wada (Long-term Forecast Manager, Japan Meteorological Agency) et al. All authors are employees of the Japan Meteorological Agency Kodansha 1965
Figure 80 suggests the impact of solar flares on the Earth's climate.
A solar flare is a rapid increase in solarwind. In other words, the 80th figure suggests a rapid climate impact.

With this data in front of us, let's use common sense.
We should know the long-term variability of the solar wind (in interglacial periods).
In terms of the numbers in this data, if you compare 12,000 years ago to the present day, they have fluctuated by over 200%.

Solarwind (charged particulates) is thought to constantly affect upper atmospheric pressure and other factors.
And since the long-term variability of the solarwind has been shown in this way, this fact cannot be ignored when it comes to climate change.


This figure suggests a "relationship between sunspots and upper atmospheric pressure.
In other words, it is "the relationship between short-term solar wind variability and upper-level pressure.
On a long-term scale, this variability will be even larger.
For those with common sense, this explanation is not necessary.

This chart illustrates why the climate varies from period to period. However, only those with common sense will understand this.

Those of you who can think logically should be good to go.
Be careful with this illustration, as it is easy to misunderstand.
Sunspots are only accompanying solar wind fluctuations.
Therefore, this short-term temperature fluctuation is in large part driven by solar wind fluctuations, and this fact and the delayed sun light variability must be evaluated separately.


書籍名:太陽黒点の予言 解明された気候変動の謎 地人書館1976 
著者:須田瀧雄博士・舞鶴海洋気象台長(当時)
Book Title: Sunspot Prophecy: The Mystery of Climate Change Revealed chijin Shokan 1976 
Author: Dr. Takio Suda, then Director of the Maizuru Marine Meteorological Observatory

The Japanese people of that time were full of challenges.
This book is very valuable. It was almost forgotten, but we were shocked to find it in a used bookstore.
The above document is a model of the effect of solar activity on climate as presented by Dr. Suda.
It is an old book from the 1970s, but it is a common sense discussion, and there is much to learn from it.

We are staring at the appearance of many eccentric researchers since the delusion of CO2 anthropogenic global warming theory began to sweep the world.

This old book has encouraged us, decades after its publication.


Some of Dr. Takio Suda's books are available to the public.

http://www.solar-activity-is-repeated.com/dr-takio-suda-boook-ep3.html

Japanese only.
Some of the books published by Dr. Takio Suda are digitized and made available to the public. Please translate and learn by yourself.
Dr. Takio Suda wrote and published this book after his retirement from the Japan Meteorological Agency.
It is regrettable that he did not publish the English version.


Global temperature changes have already been
determined for hundreds of millions of years.

Dr. Kaerusan

I will repeat the message.KERO.
Use common sense.
I know it is difficult for Asperger's, but please have kind people around you to assist you.KERO.

This data tells us a lot. It tells us what will happen in the coming millions and tens of millions of years in the future.KERO.

There is a clear periodicity in this data as well. We can roughly predict the period after tens of thousands or hundreds of thousands of years based on this data.

However, this law will end in a few hundred thousand more years. This can be seen in the data I just mentioned.KERO.


NEW

We would like to improve the accuracy in the future.

If analyzed from a big picture perspective, a simple thing is happening.KERO.

This illustration shows how sunlight affects the climate of Venus.KERO.

We have established on this site that solar activity (solarwind, sunlight) is highly variable and cyclical.
There is one thing that is considered to be common sense.
The events on Venus shown in this illustration also have a periodicity.

In the future, when discussing climate change, it will be necessary to analyze other things as well.


From the ancient records of Japan

Professor Papamogu

Japan has an interesting ancient record.
There are years when extremely cool summers occur.
When we unravel this fact, we can understand the "relationship between solarwind and climate.


There are unique cold summer outbreak models that occur only in Japan.
You can easily recognize it in the ancient records. And no matter how old the records are, we can identify that this climate model has occurred.
This cool summer is called "cool summer by Yamase.

This model occurs for a few days each year.
However, when adverse conditions are combined, many days in the summer are like this, resulting in a poor agricultural crop.

Atmospheric refluxes around the world are connected. Therefore, in the summer when a cool summer like this occurs in Japan, the climate in your country (a country in the northern hemisphere) should be different from a normal year.
Are you having a very hot year or a year with no rainfall?
Or extremely rainy? Either way, it should have been a summer with an extreme climate.


example, August 15, 2021 at 15:00

:High
:Low


example, August 15, 2021 at 17:00
Windy.com


example, August 16, 2021 at 12:00


example, August 16, 2021 at 18:00
Windy.com

It is only an event caused by the rivalry between northern and southern forces.
They are constantly fluctuating, so there are also typical models for extreme heat wave years.

Incidentally, around August 15, 2021, flooding occurred along the Yangtze River in the People's Republic of China, which was affected by this front.

As of 2022. We are not as interested in sunspots and climate as we used to be.
The above illustration was published in the past, but is included here for reference. The blue line (Yamase cool summer year) in the above figure shows the occurrence of the "cool summer typical model" mentioned above.
Cool summers in Japan are very convenient for researchers.


Original data, carbon 14 measurement in annual rings | Cosmic Ray Physics Laboratory, Nagoya University (CR Laboratory)

Periodicity can be in the tens of millions of years. Therefore, there is no strong need to be concerned about what is shown in the illustration above, but similar periods existed in the past.

Many things would have been similar.


Reference. Relationship between solarwind and sunspots.
Adapted from Wikipedia.

Some 2500 years or so ago, a period (i.e., the prototypical period for the solarwind cycle from 1700 to the end of 2019).
It seems possible to recover sunspot data from that era.
That's what you notice when you look at the figure above.

The relationship between Galveston hurricane and Dorian hurricane is remarkable.
This is because the changes in sunspots are similar to 120 years ago.


Dorian2019 NOAA/RAMMB

We have a zero dollar budget.
The world is deluded about CO2 anthropogenic global warming and resulting climate change.
Hence, although the rate of research is slow, it is better to consider the periodicity of solar activity and climate in this way.


和・凶荒誌・梅森三郎 編 出版者: 有隣堂 1893年

Kyoukoushi, edited by Saburo Umemori Publisher: Yurindo, 1893 From the Appendix 
The period begins in B.C. Note that it is written in imperial history, and converted to western calendar in minus 660 years.

Here are recorded about 2,000 years of extreme climate years. (Needless to say, these are old records, so they are fragmentary.)
The fact that cool summers and extremely hot summers in Japan occur according to a typical model gives some indication of the climate model of the time.

That fact is very valuable for the study of climate change, and while it is inconvenient data for those who believe in CO2 anthropogenic global warming, researchers who are interested in a healthy study should pay attention to the events in Japan.


The material linked below is one of the valuable old records.
Since it is an ancient book, it is not in modern language. Even Japanese people have difficulty reading it.
This material also records abnormal weather such as cool summers in old times, but abnormal weather occurs every year.
Please tell us about any country or region on this earth that continues to have normal weather.
This planet continues to have abnormal weather. And will continue to do so. Extreme weather is normal.

和・日本災異誌 小鹿島果 1893年
https://dl.ndl.go.jp/info:ndljp/pid/770752
Digital Library, National Library of Japan


Japan, an island nation on the east coast of Eurasia, is the most vulnerable to disasters caused by cool summers on earth - the 1993 Heisei Crop Crisis, the 1980 Cold Disaster, the 1783-88 Tenmei Famine, etc.
Independent Administrative Law Firm Institute of Disaster Prevention Science and Technology Natural Disaster Information Office
https://dil.bosai.go.jp/workshop/02kouza_jirei/22reika.html


In other words.
The Pacific side of Japan's northeastern region is the most vulnerable to the effects of solar activity on climate change in the world.
Therefore, you cannot call yourself a researcher without knowing the data from this region when discussing solar activity and climate change.

This is the reason why this site was released from Japan.

The Japanese word for Japan is 日本 Nihon.
日 means "sun.
Japan is the land of the sun. Therefore, it is natural to feel a sense of destiny to make such an announcement from Japan. In American sense, it would be called "ON A MISSION.


Solar activity and geomagnetism

Dr. Kaerusan

Please see the figure below for a quick overview.KERO.

Although it is impossible to say for sure due to limited data, there appears to be a relationship between the solarwind cycle and declination variation.

We wonder if this declination variation was also occurring during the solarwind cycle 2500 years ago, as shown earlier in Chapter 7.KERO.

if
geomagnetic inversion point phenomena were related to large cycles of solar activity?
Wouldn't this have happened during the major cycle about 33 million years ago?
If we analyze the strata from 33 million years ago, can we predict the next geomagnetic reversal point? KERO.


Professor Papamogu

If these temperature fluctuations were caused by variations in sun light, then the geologic age divisions were also caused by variations in sun light.


It seems to be compatible with the geologic age classification.
I think the extinction and evolution of organisms may be related to the great cyclicity of solar activity.

periods of mass extinction of plants and animals that have occurred so far. This would have been brought about by major fluctuations in solar activity.
This is what we can conclude from a holistic analysis.

Dedicated to Professor Jan Veizer and team at the University of Ottawa.


Predicts a period of human extinction

Dr. Kaerusan

An era of human extinction.
It may be caused by fluctuations in solar activity.KERO.


We cannot deny that there are many things we do not understand at this time.
We understand it this way at this time.KERO.

Two major scenarios are thus possible. If scenario A occurs, we are in trouble.
However, it is a cataclysmic event that will occur in about 1 million years. We do not know if we will be able to survive until then.KERO.


Professor Papamogu
Professor Papamogu
Dr. Kaerusan


Thank you for watching this far.
We'll end today by playing with you all to change history!

Let's do an experiment with this data.

Then please!

For the first time in human history!
We've changed the past of solar activity!


We've pranked the times when the solarwinds were rising big time! The moles have changed the past!

Seems that when we changed the solarwind,
the sunspots were also affected!


This prank could have influenced what happened in Japan in 1700 AD.


Reference.

September 17, 1770 AD. A large aurora occurred over the Kyoto Sea (Sea of Japan) in Japan at a time when the solarwinds were rising significantly.

It is extremely rare for such a huge aurora to occur in Japan.
We now know that this was a time when the solarwinds were greatly increasing. The number of sunspots observed was also rising.


Same day. Paintings by other authors

Reference

If the solar wind mountain around 1770 AD were made smaller, this aurora might not occur.

Dr.Kaerusan

Good influences may also occur.KERO.


天明飢饉之図・会津美里町教育委員会
Tenmei Famine, Aizu Misato Town Board of Education

Japan has more ancient records about climate than any other country.
There have been several major famines since the Maunder Minimum.
The most significant famine was the "Tenmei Famine.

The Tenmei famine occurred mainly in present-day Miyagi, Iwate, and Fukushima prefectures and the Pacific side of the Tohoku region.

1782 (2nd year of Temmei era)
Uneasy weather from early spring to autumn

1783 (3rd year of Temmei era)
Cool summer (yamase) occurred during the summer season. Very bad harvest (the characteristic cool summer in Japan described in Chapter 7).

1784 (4th year of Temmei era)
Extreme heat. Rice and other seeds were lost due to the very bad harvest that had occurred the previous year. Many farmers died of starvation.

1785 (5th year of Temmei era)
A year of long rains, mainly during the summer season.

1786 (6th year of Temmei era)
A year of long rains, mainly during the summer season

The painting mentioned earlier was probably painted by a person of the time, based on hearsay information.
And the clothing suggests that it depicts the year 1784, the year of the heat wave.

Cannibalism is depicted in the painting. It is a historical event and has been documented. The Tenmei famine left many farmers on the Pacific side of the Tohoku region without food.
The combination of extreme weather and heavy taxes made the Tenmei famine even worse.

We pranked the solar activity around 1770 to make it smaller.
If that prank had a positive effect on westerly wind fluctuations, we might be able to pretend that the Tenmei famine of the 1780s never happened.KERO.

1780s. France was also experiencing poor harvests in agriculture and citizens were resentful of heavy taxes. This led to the French Revolution from 1789 to 1795. That is what we learn from books.

If this is true, it was the time of the Tenmei famine in Japan.KERO.
If pranking the past of solar activity had resulted in a bountiful harvest, the French Revolution might not have happened.KERO.

Because of the westerly wind fluctuations, there would have been countries and regions with poor harvests, and others with good harvests.
Climate change does not mean that the entire planet will experience crop failure, but rather that there will be a bias. It would be better if we could distribute it fairly without borders.KERO.

Japan is the most vulnerable in the world to climate change caused by fluctuations in solar activity.
The concept of the solar wind cycle greatly advances our understanding of climate change.

This section supplements natural phenomena that can be found to be associated with solarwind cycles.


Supplementary Information Climate Change in Japan

Kagawa Prefecture's official website provides very informative information.
Information on climate change since 732 AD is available. However, it is an old record, so it is fragmentary.
Even if a Yamase-type cool summer is occurring on the Pacific side of the Tohoku region of Japan, drought may continue in Kagawa Prefecture.
Rice cultivation in Kagawa Prefecture tends to be more prone to crop failure years due to drought than to cool summers.

Kagawa Prefecture Official Site
Until 1602
Until 1735
Until 1945
Until 1988
Until 2022

Again, Yamase-type cool summers occur only on the Pacific side of the Tohoku region of Japan. No other country has ever experienced a Yamase-type cool summer.
That is why we can rely on the Yamase record to bring to light the atmospheric reflux hundreds of years ago. These records are ideal for this kind of research.
In Japan, research on the relationship between solar activity and Yamase began in the 1920s. At that time, the research was conducted by a national institution.
By the 1980s, many people began to forget about it, and by the 2000s It was almost forgotten.
Mogura-no-Mogu team started analyzing solar activity and Yamase in 2017, which led to the launch of this website.

In the 1920s, Dr. Hirotaro Ando made a presentation on the relationship between solar activity and Yamase. About 100 years have passed since then. I feel a sense of destiny that Mogura-no-Mogu team has sublimated the Yamase analysis and made such a presentation.


Professor Papamogu

These are called thought experiments.

Well.

In Japan, famines similar to the Tenmei Famine have occurred many times since the Maunder Minimum.

Tenmei Famine, 1780s (和・天明の飢饉)
120 years later
Meiji Northeastern Famine, ca. 1900-1910 (和・明治東北飢饉)

Tempo Famine, 1830s (和・天保の飢饉)
120 years later
The 1950s: a period of continuous cool summers

Japan should not be the only country affected by westerly wind fluctuations. Extremes would have occurred in many countries in the Northern Hemisphere during that period.

This is the illustration I introduced earlier, which shows the relationship between the period of continuous cool summers and sunspots, mainly on the Pacific side of the Northeast region of Japan.

We have developed our confidence in the periodicity of solar activity based on this fact to our current understanding.

The full study will begin on November 21, 2017

We would like to add something about this illustration.
There was a curious 120-year cycle from the Maunder Minimum until the 1950s.
However, it is only an event limited to this, the era of the solarwind cycle (circa 1700 to the end of 2019).
It appears that a new sola wind cycle era is beginning in 2020. Then, the past will not apply at all.

There was a peak in solarwind around 1960. However, the sunlight cycle does not appear to peak at the same time. There is a delay.
How long is that delay? The mechanism is not well understood at this time.


In the era we have been experiencing for a long time (one solarwind cycle, 1700 to the end of 2019), the average number of sunspot observation cycles was about 10 years.
We do not have a complete set of all the data on natural science about even that one era.

A proper reading of the historical data reveals that the sunspot observation period varied during different periods of the solarwind cycle.
The reality of climate change will be different for each solarwind cycle.
And immediately from 2020, sunspots are different from the previous periods. This means that the periodicity of climate change will also be different from previous eras (if Cycle 25 ends in about 5 years). (If Cycle 25 ends in about 5 years, the solarwind cycle in the new era will be about a 5-year cycle.)

We are now entering uncharted territory.
Even more so, we will be asked to analyze the situation in a healthy and common sense manner.


There are many things we don't know.
But there is one thing we can say for sure.
We cannot predict the future of solar activity with any precision at this time, but the future of solar activity has been established for more than a few hundred million years.
This situation today has been established for more than a few hundred million years.
And the future situation has already been determined.
That is the truth within the solar system.

It's a bit of a layering process.

That concludes this presentation.
Thank you very much for your time.


To everyone around the world

In this universe, everything is in flux.
And in our solar system, there is a periodicity in solar activity, which is the basis for the constant fluctuations.

No two clouds are the same.
You will never see the same sunset.
No two rainy days are the same.
No two waves are ever the same.

You will never have the same moment twice.
The climate is always changing. And your body is always changing.

Let's face reality.


Projected climate change after 2022

The cycle of the number of sunspot observations from about 1700 AD to the end of 2019 was approximately an 11-year cycle.
In the new solar wind cycle era that began at the end of 2019, the sunspot cycle is expected to be much shorter.

If this were to become a real event, the next periodic unit would also change at the same time.

Official website of Japan Meteorological Agency, Ministry of Land, Infrastructure, Transport and Tourism

https://www.data.jma.go.jp/gmd/env/ozonehp/3-24ozone_o3variability.html

─Total ozone
・・・・Solar Radio Flux

Figure 1 Relationship between solar activity and monthly average total ozone in the tropics.
Time series of 13-month moving average (solid black line) and solar radio flux (dotted red line) of monthly mean total ozone (averaged from 30°S to 30°N) based on satellite observations. Seasonal components have been removed. The solar radio flux (3,750 MHz) was provided by the National Astronomical Observatory of Japan (NAOJ), and the total ozone value from satellite observations was provided by the National Aeronautics and Space Administration (NASA).


Quasi-biennial oscillation (QBO)

In the stratosphere near the equator, it is known that easterly and westerly winds alternate with a period of about two years, and this phenomenon is called the quasi-biennial oscillation (QBO). On the other hand, when the QBO is negative, the total ozone decreases near the equator. On the other hand, when QBO is negative, i.e., when QBO changes from easterly to westerly with altitude over the equator, total ozone increases near the equator and decreases around 25 degrees latitude from north to south. This correlation is caused by a combination of variations in the stratospheric zonal winds over the equator and variations in the large-scale circulation of the atmosphere in the north-south direction.


These cycles would vary with the solarwind cycle.


The periodicity as shown in the above figure will also fluctuate.

It is easy to understand once you grasp the essence.
Let's move forward into a new era.


The fluctuations in solar activity captured in this video may have been confirmed over tens of millions of years ago.
Apparently, many things that happen in this universe are probably already fixed.

We are proud to be the first to announce this fact to mankind.

In addition, this research is the first scientific publication in my life.
We think We should thank God that We was able to publish such a magnificent fact in my first research.
We intend to live my life accepting it humbly.

Thank you Jesus! Baby!(From the radio at the DAYTONA 400 finish line in 2022)


mogura-no-mogu.com Official Blog
Learn more about this announcement in Japanese

https://mogura-no-mogu.blog.ss-blog.jp/2021-02-18-solar-system-theory-v4

https://mogura-no-mogu.blog.ss-blog.jp/2021-02-11-cycle-25-yosoku

Yes!

Solar activity is repeating !


We want to ask researchers all over the world.
Why didn't you doubt this fact first?
Why ignore the large cycle of solar activity?
This is the most likely event.
We think it is very difficult to prove that there is no great cycle in solar activity.


Spread Good Energy (Brittany Maynard's Message)

There is a lie spreading in the world today. It is bad energy.
Mogura-no-Mogu team is continuing its research today to cut off the bad energy.
Someone's words are pushing Mogura-no-Mogu team forward.
We have never forgotten the words of a certain person.
We hope that good energy will overflow from this site to the world.

We will not interfere with any comments submitted

LINK


SILSO
http://sidc.be/silso/


Department of Cosmic Ray Research, Institute for Space and Earth Environment, Nagoya University Radiocarbon 14
https://www.isee.nagoya-u.ac.jp/CR/research/c14/

  Relationship between Solar Activity and Cosmic Ray Variability and Climate Change over the Past 1200 Years Author:Professor Hiroko Miyahara
https://www.jstage.jst.go.jp/article/jgeography/119/3/119_3_510/_pdf
 

NASA What Is the Solar Cycle?
https://spaceplace.nasa.gov/solar-cycles/en/


Tohoku Miyagi Prefecture disaster chronology
https://www.pref.miyagi.jp/uploaded/attachment/299929.pdf


From Tohoku Iwate Prefecture official website
49th Special Exhibition “Food that Saves Life” – History of Famine and Food for Living ”
http://www2.pref.iwate.jp/~hp2088/park/kikaku/49th_inochi_tabemono.html


Yamase initial research
https://core.ac.uk/download/pdf/160748922.pdf


Mr. Shiro Masamura's presentation manuscript, Kyoto University server storage data
https://www.dpac.dpri.kyoto-u.ac.jp/mukou/meeting/Report/04/masamura.pdf


Old research information that remains in Japan.
These studies have led to the discovery of the 120-year cycle by Shiro Masamura.

Japanese famine record : Saburo Umemori 1893
https://books.google.co.jp/books/about/%E5%87%B6%E8%8D%92%E8%AA%8C.html?id=-9MmKoZwT2gC&redir_esc=y

Great famine and sunspots : Katsutoshi Taguchi 1923
https://www.jstage.jst.go.jp/article/jmsj1923/3/5/3_5_128/_pdf/-char/en

Isn't the Showa bad harvest group coming soon? Hidetoshi Arakawa 1953
https://www.jstage.jst.go.jp/article/jmsj1923/31/11-12/31_11-12_390/_pdf

Sunspots and weather : Yukio Kawabata 1960s
https://www.jstage.jst.go.jp/article/jgeography1889/61/4/61_4_121/_pdf

Climate change in the Tohoku regionTadashi : Ozawa, Toshio Fujita 1952
https://www.jstage.jst.go.jp/article/jmsj1923/30/6/30_6_190/_pdf

Concerns of abnormal bad harvest year from the viewpoint of sunspot trends : Sakuhei Fujiwara 1949
https://www.jstage.jst.go.jp/article/jmsj1923/27/11/27_11_350/_pdf

Statistical survey on famine in the Tohoku region : Saburo Umeda 1965
https://www.jstage.jst.go.jp/article/agrmet1943/20/3/20_3_97/_pdf

We introduced a part this time.


The climate in the Tohoku region is sensitive to solar activity. Therefore, many scholars have been aware of the periodicity of the climate in the Tohoku region since the old days.
However, the sunspot observation data was still less accumulated than it is now, so research seems to have stopped before discovering definitive evidence.
Now no one has remembered this series of studies.

We hope this fact will spread throughout the world through this site.
May the Force be with You.
May the Force be with humany.


A number of scientific data can be explained by a one theory.
What is One Theory ... Repeated solar activity.
It is named Mogura no Mogu 's theory of relativity.

Previously published content

Contents published until August 20, 2022


This is a personal story.

Professor Paapa ogu and Dr. Kaeru-san love NASCAR.
Reducing CO2 makes no sense at all. So NASCAR is fine to continue with reciprocating engines.
In 2022, the wheels will be made of aluminum. I was confused by the unfamiliar design. The symmetry of the car has increased the chances of seeing backfires.
Despite the pandemic caused by SARS-CoV-2, NASCAR has continued without being canceled.
We were encouraged by the American spirit.
Inspired by the energy that comes from NASCAR, this analysis is a big step forward.

God Bless NASCAR!
God Bless America!


kawaii desu! kyun desu!

A big thank you to the DeePL translation site.
It is a very nice site.
It has been very helpful in presenting this analysis.

God Bless DeePL!


Professor Papamogu

Dr.Kaerusan


On the occasion of this renewal, we are moving into the next era.

In this renewal, we have presented the concept of the solar wind cycle.
The solar wind cycle has a unit of about 33 million years, a unit of tens of thousands of years seen in glacial cycles, and a unit of a few hundred years seen in interglacial cycles.

In the present day, life on Earth revolves around that using the orbital and rotational cycles of year, month, and day, but don't you think we should start up and operate a solar activity generation separately from that?

In the solar activity generation from about 1700 AD to the end of 2019, the sun sunspot one pitch was about 11 years. If that were to change to a period of about 5 years after the end of 2019 A.D., it would be a complete change from previous eras.

Western calendar years and dates alone do not follow critical facts in the natural world. Why did the climate change controversy exist? It is because we were unaware of the solar activity generation.

Imagine this.
What if super-advanced intelligent life living on a solar-type star is real? They would certainly have launched a solar active generation. In this light, I would say that humans are a rudimentary intelligent life form.

In other words, intelligent life that does not also use stellar activity generations as a calendar is at a rudimentary level.

For a planet belonging to a stellar system, the stellar activity cycle is an absolute time axis. An intelligent life form that is not aware of this cannot be considered to be at an advanced level.

The new solar activity century is starting immediately at the end of 2019. A new era has begun. There is no time to relax.


What is a glacial cycle?
It was solar activity generation.

The present day is
Late Cenozoic Generation (about 33 million years)
Number x warm period (20,000 years?)
Number x generation (160 years?) (from the end of 2019 A.D.)
Such a classification would give life on Earth a high level of understanding of their situation.


Explore aptitude in the field of climate change research
Self-Check Test


Please answer yes or no. Each will be rated by the number of responses.

Question 1
Do you know that research and work must be approached calmly and carefully? And are you able to practice it?

Question 2.
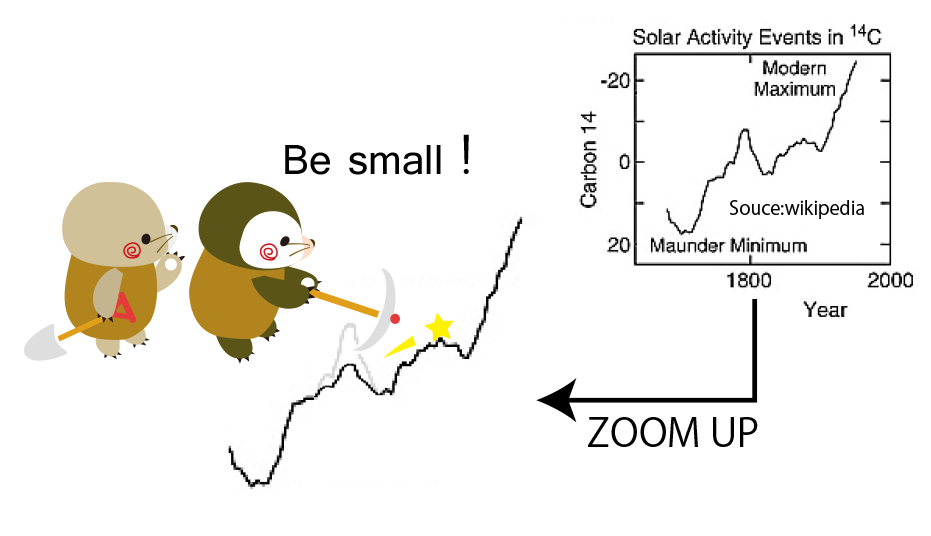
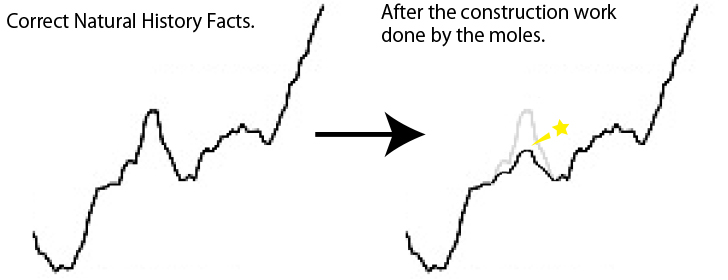
Do you understand that if you make a foolish announcement, you will cause trouble for others and the world?

Question 3.
Do you understand that you have to connect and explain everything in your scientific presentation?

Question 4.
Do you understand that the Mogura-no-Mogu team is always based on common sense considerations and always able to make common sense conclusions?

Question 5.
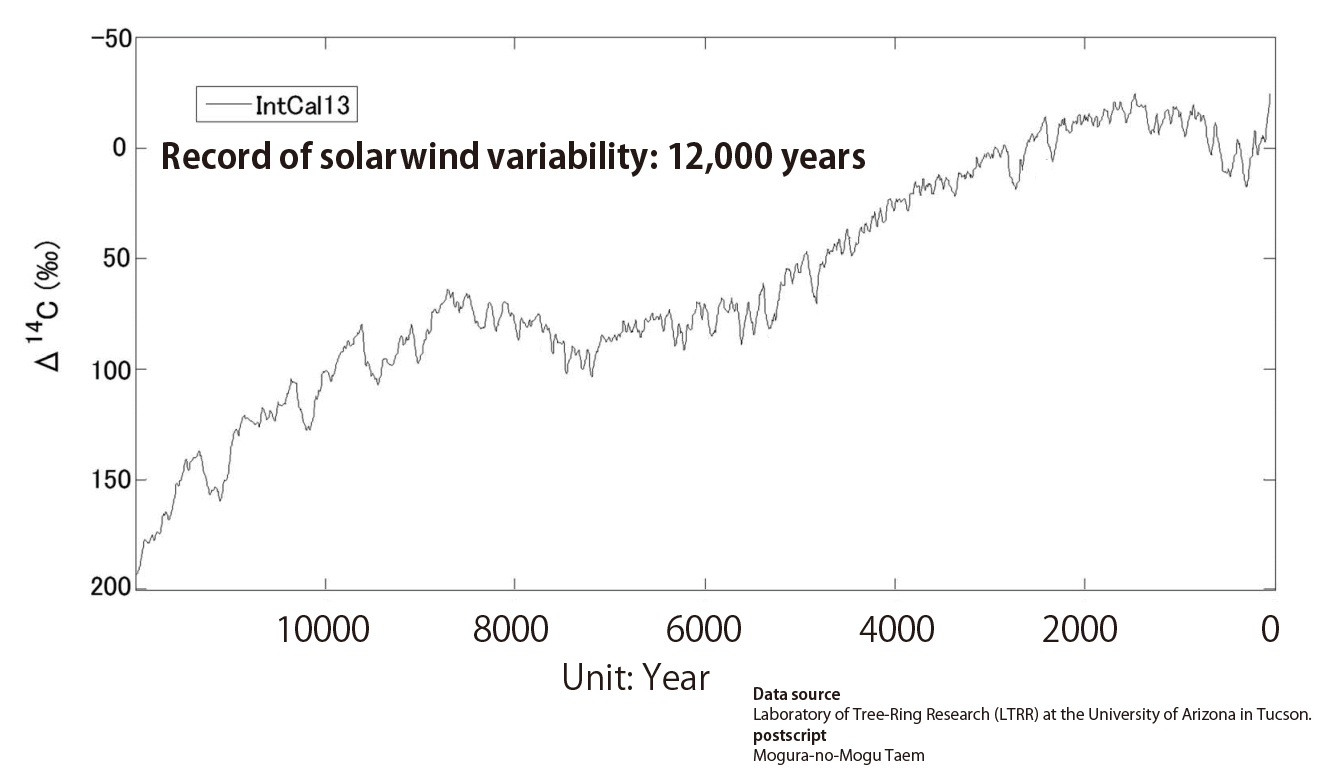
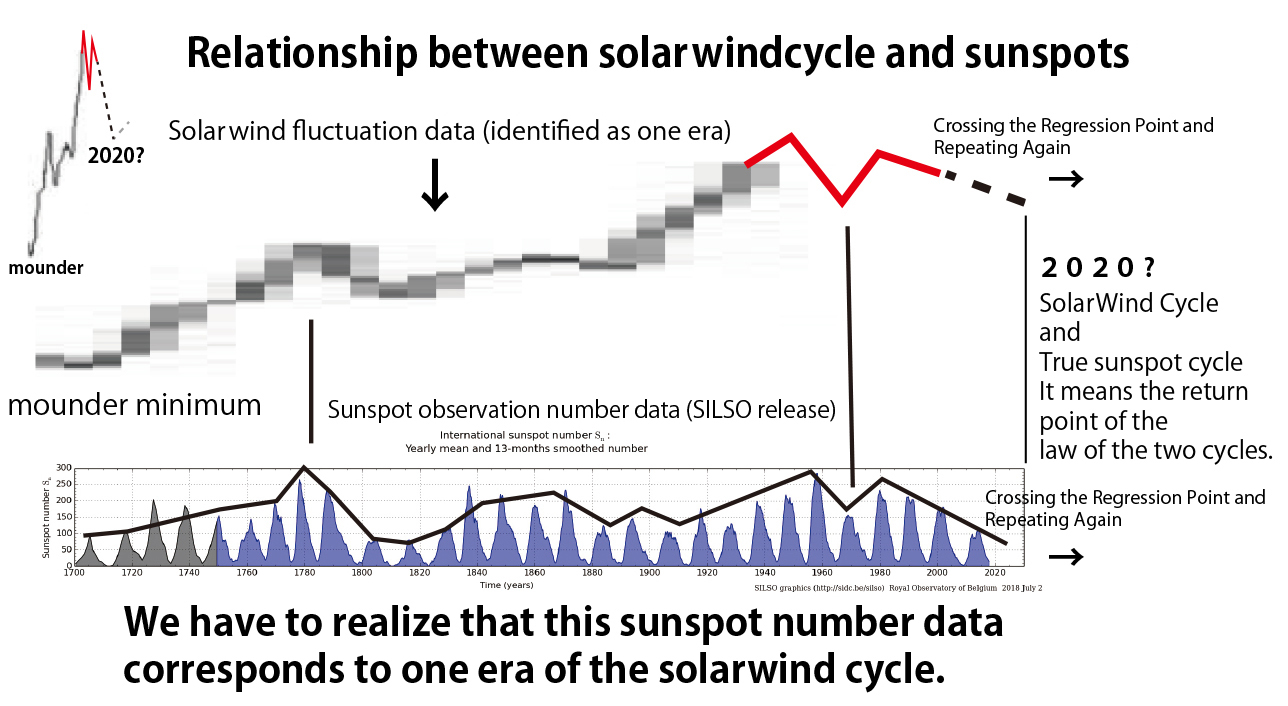
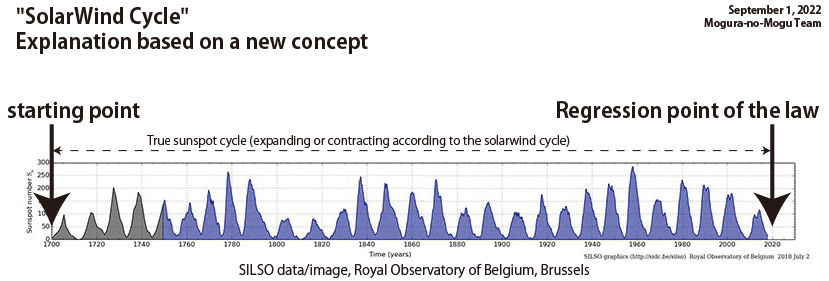
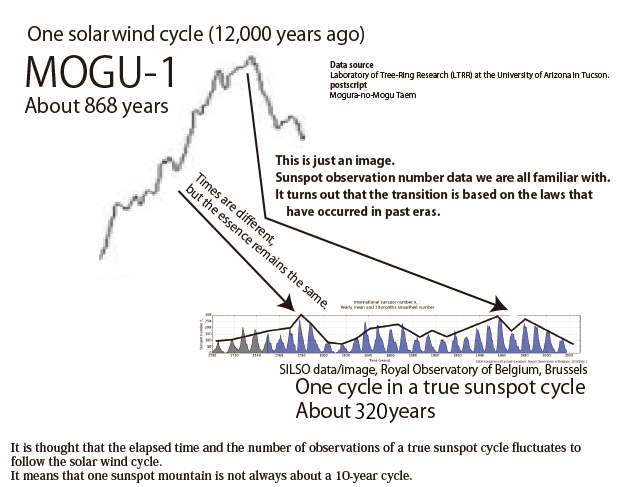
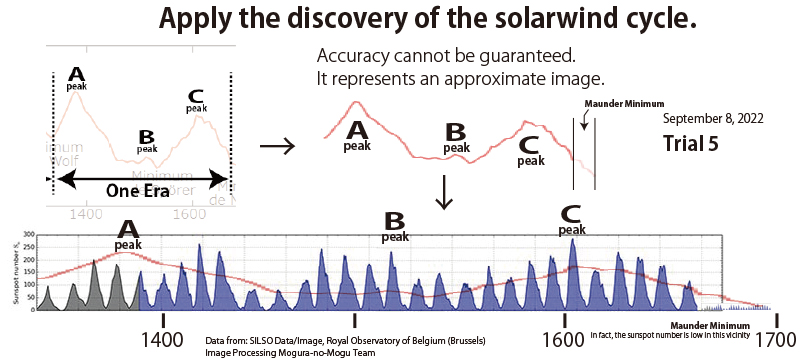
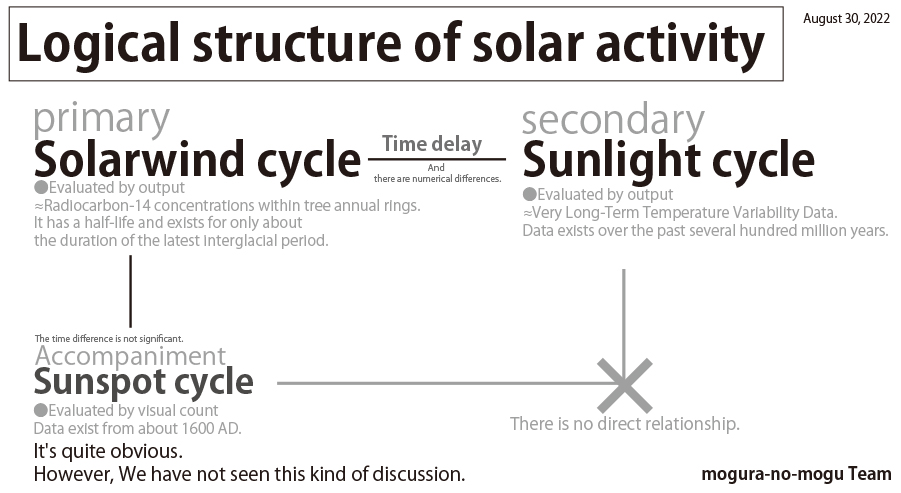
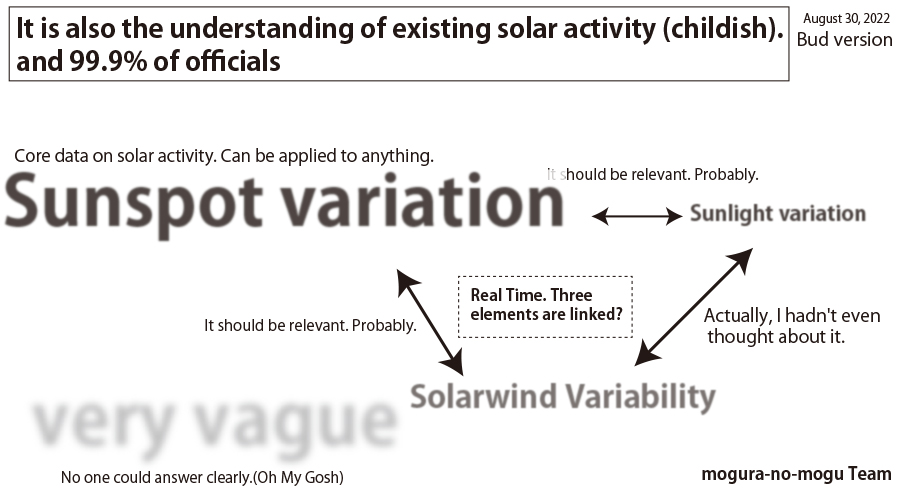
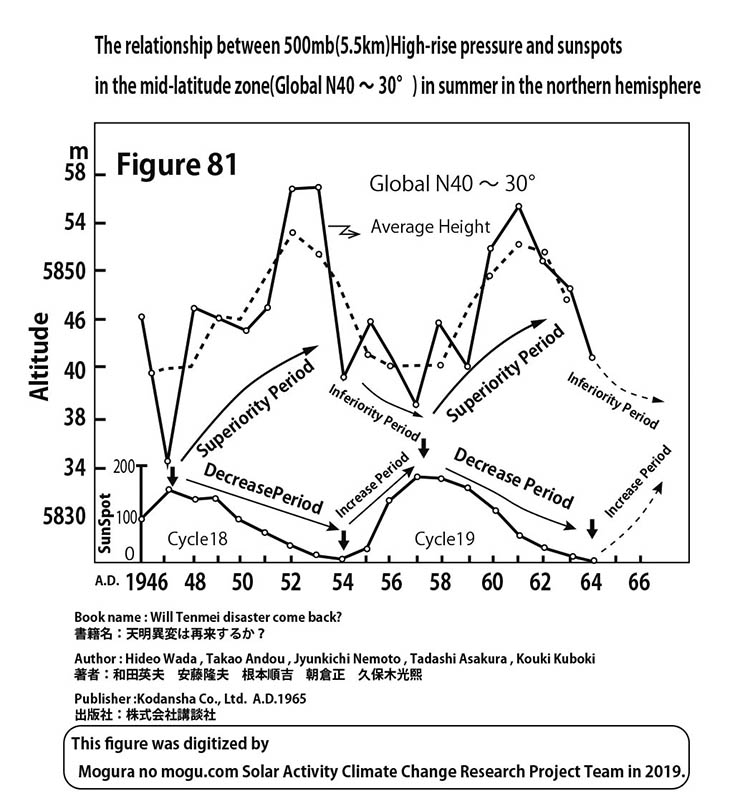
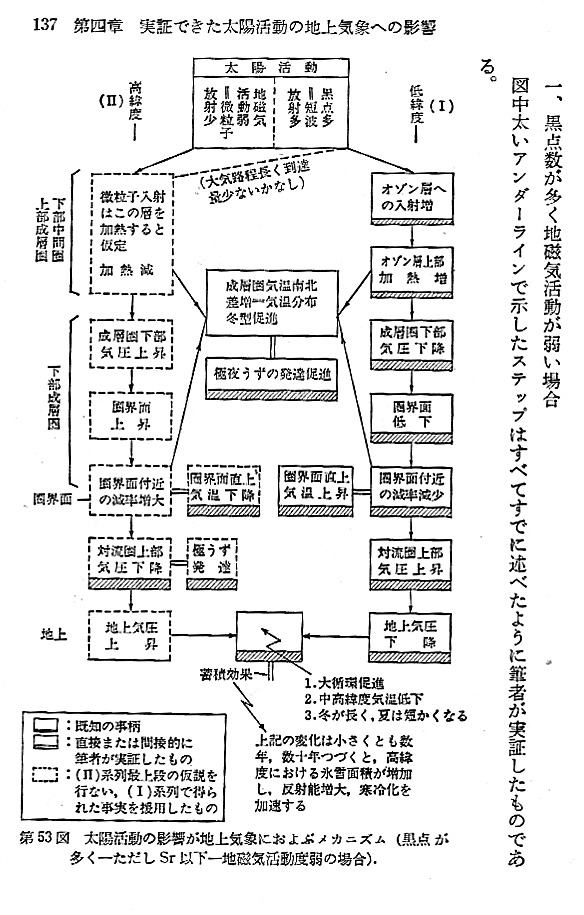
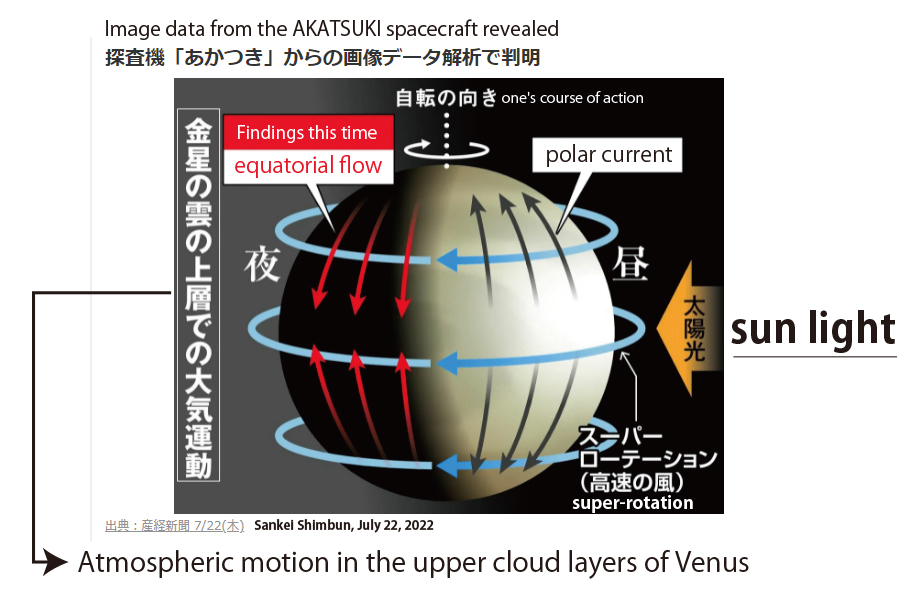
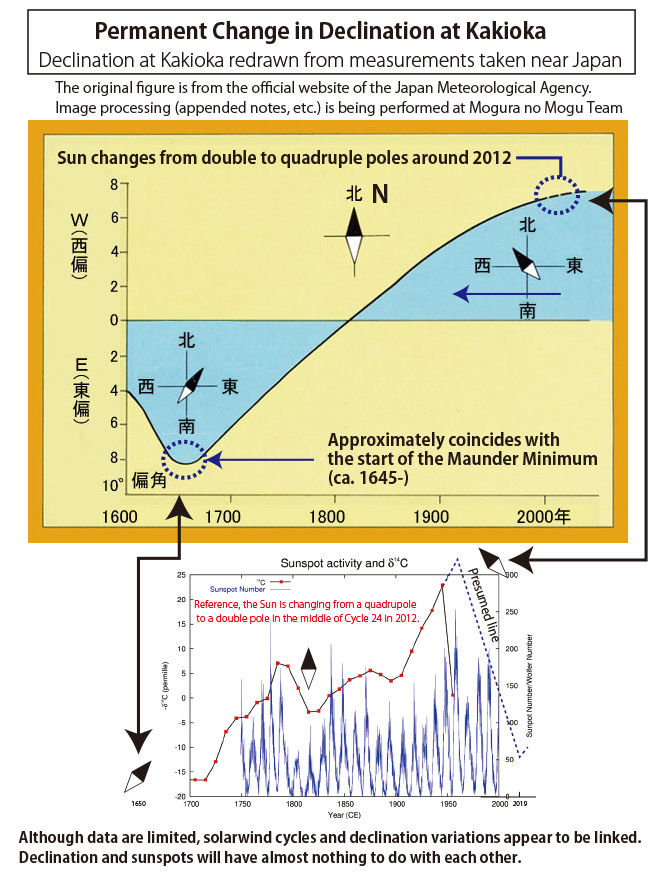
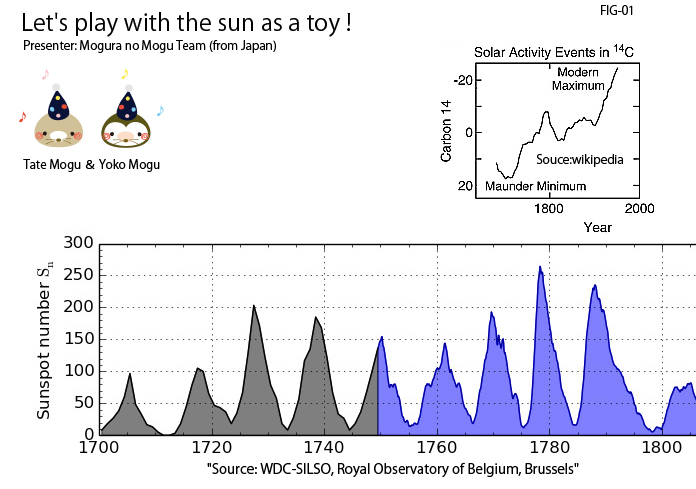
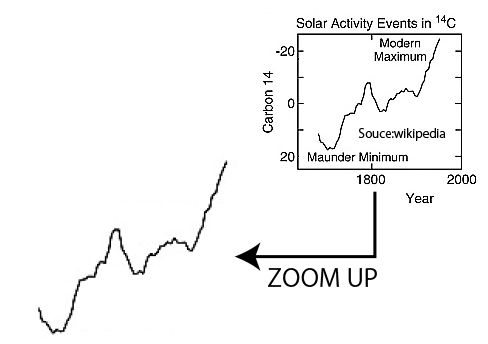
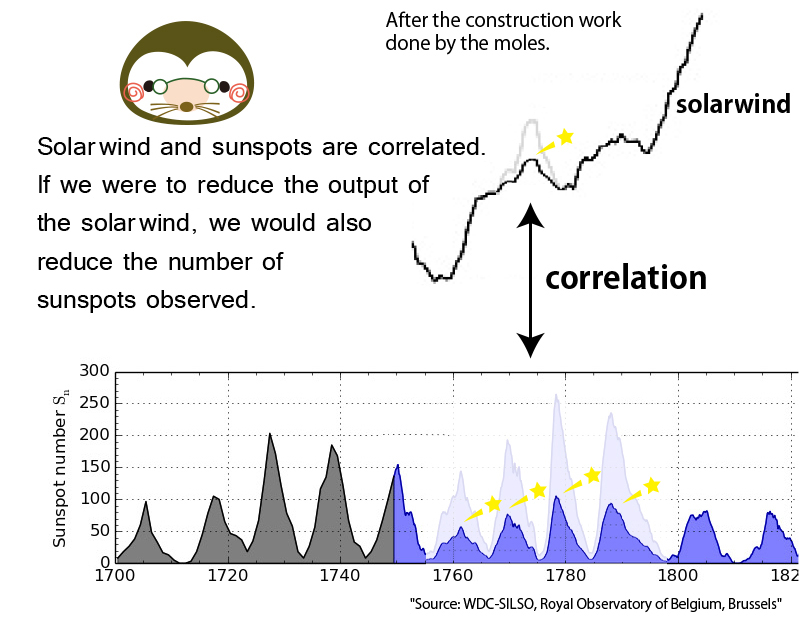
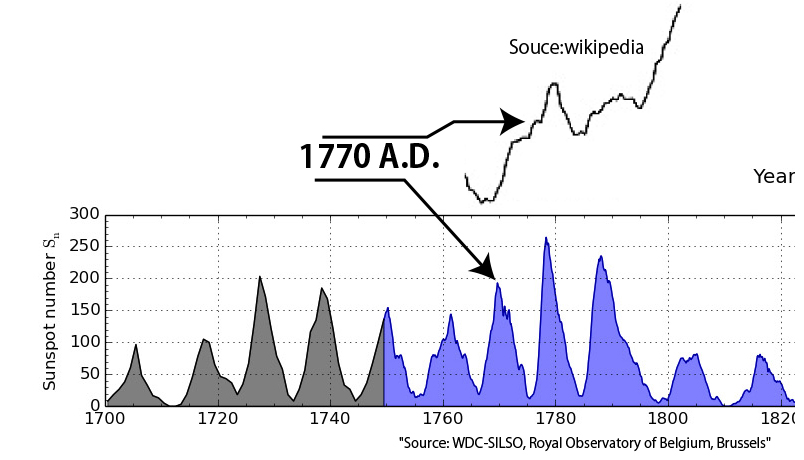
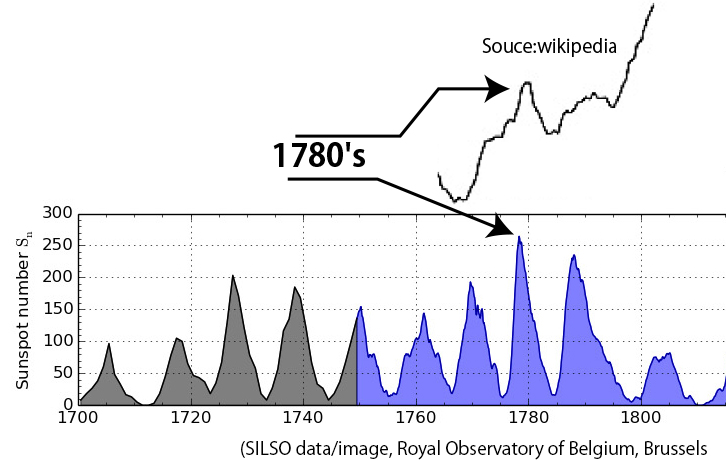
Can you correctly diagram the relationship between solarlight, sunspots and solarwind? Did you understand that there is a logical structure there?

Question 6.
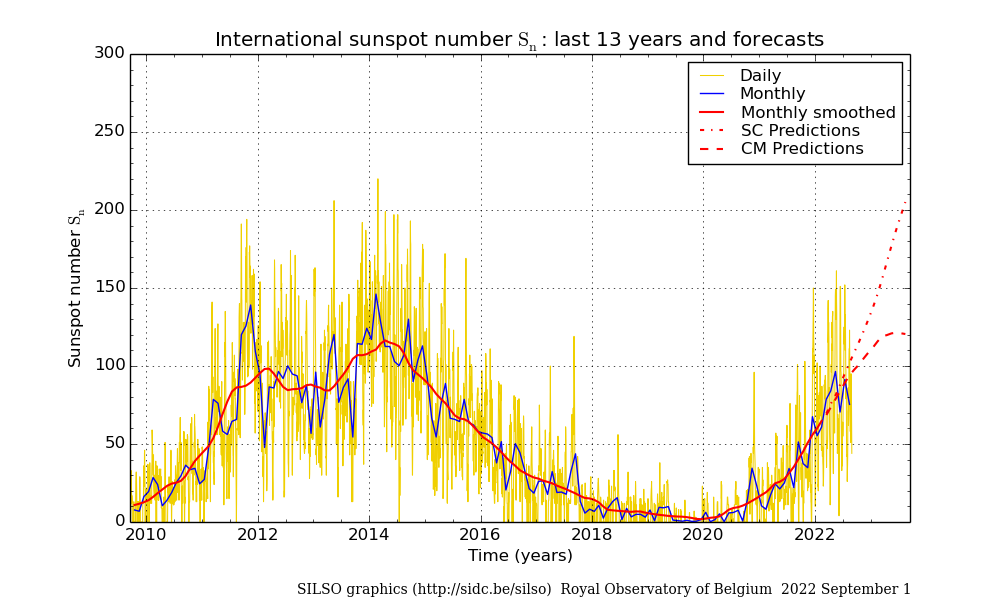
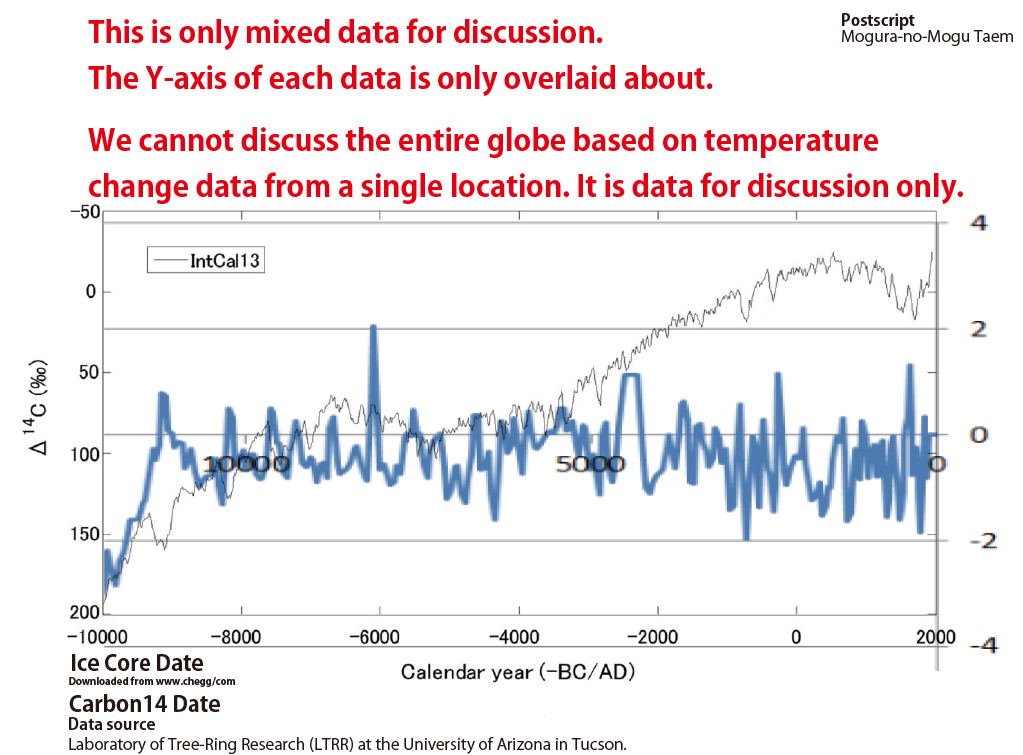
Do you understand that discussing sunspot data and global climate change is an act that lacks premises?

Question 7.
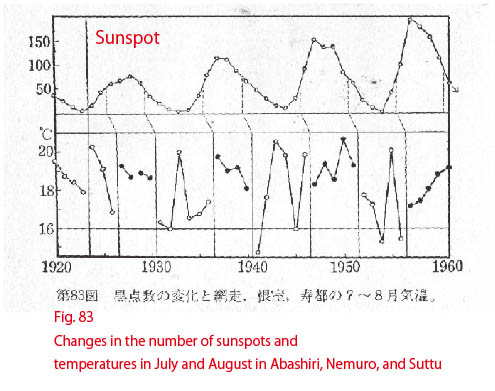
Have you come to understand that comparing and contrasting sunspots with the average temperature of the earth is a foolish act that lacks premise?

Question 8.
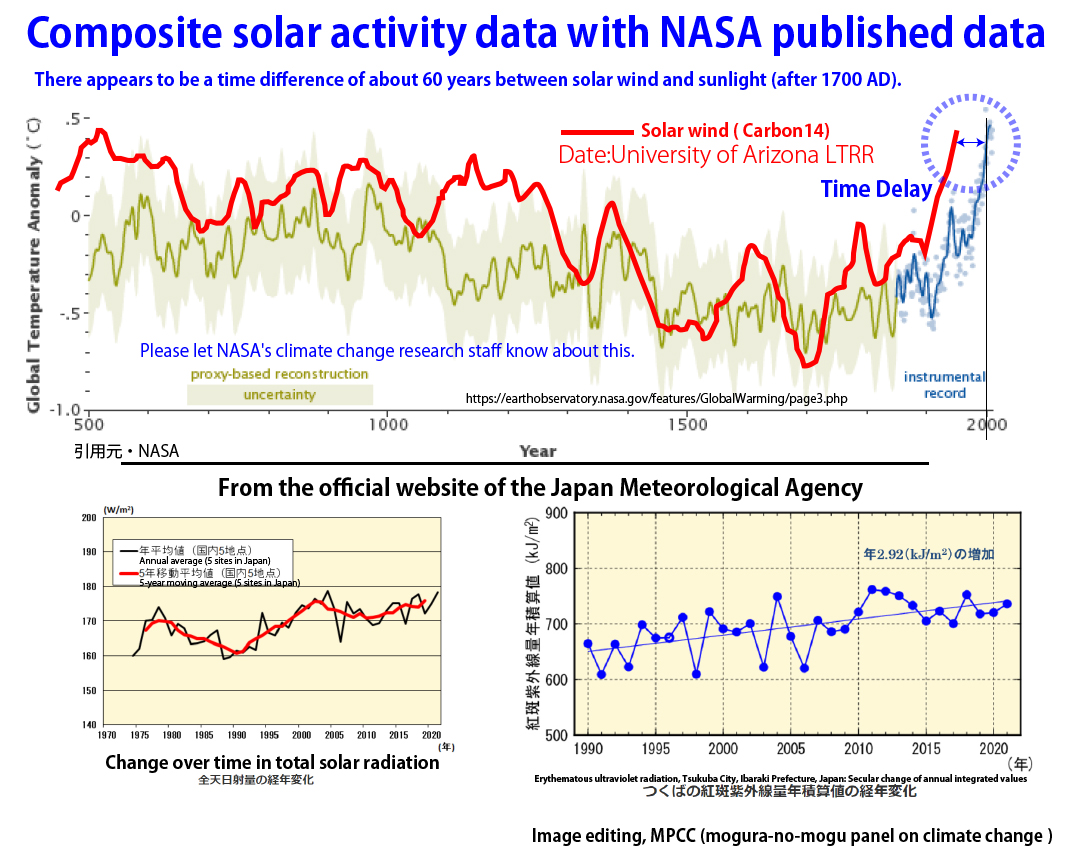
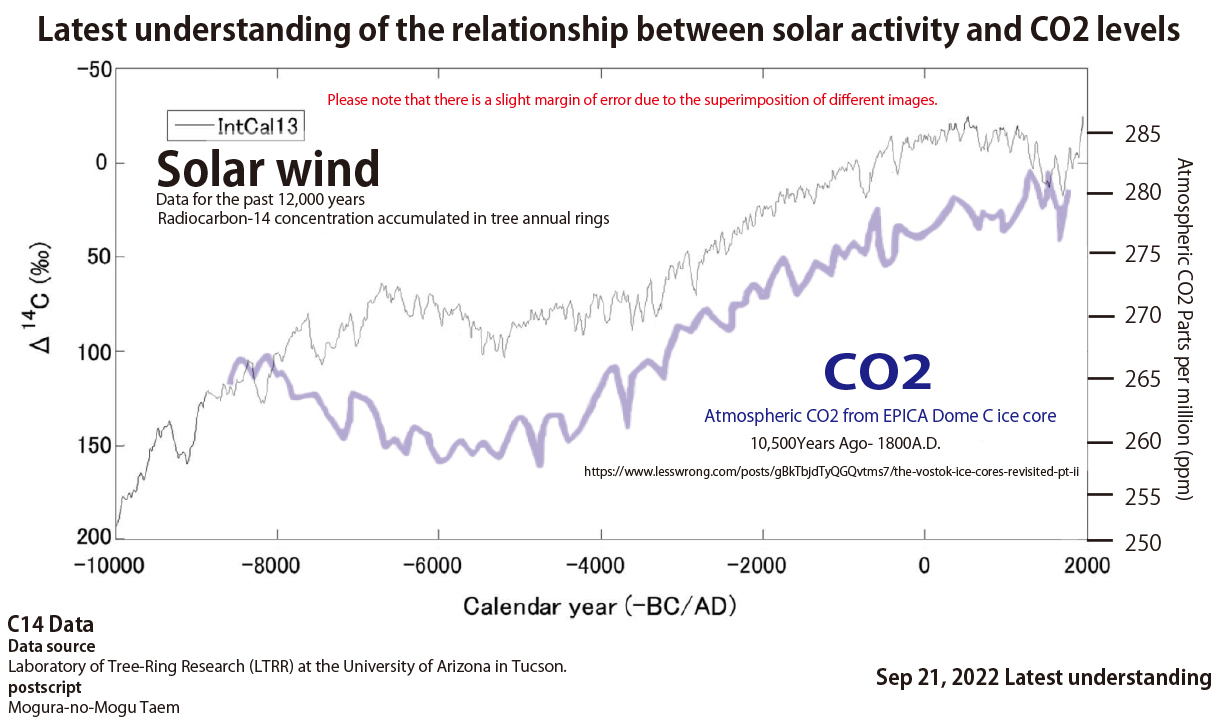
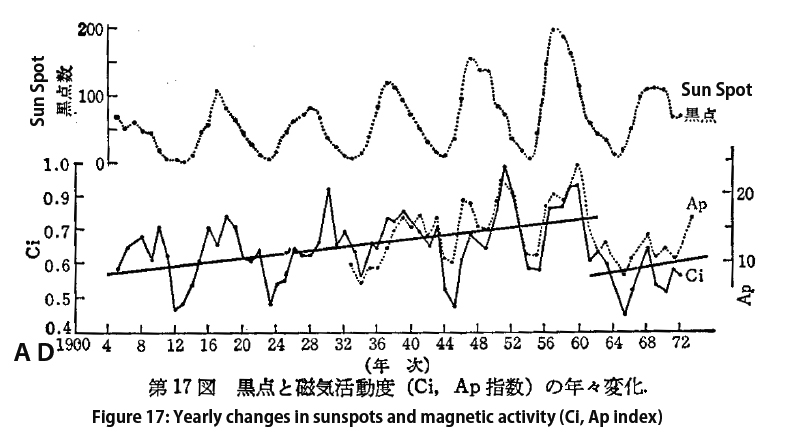
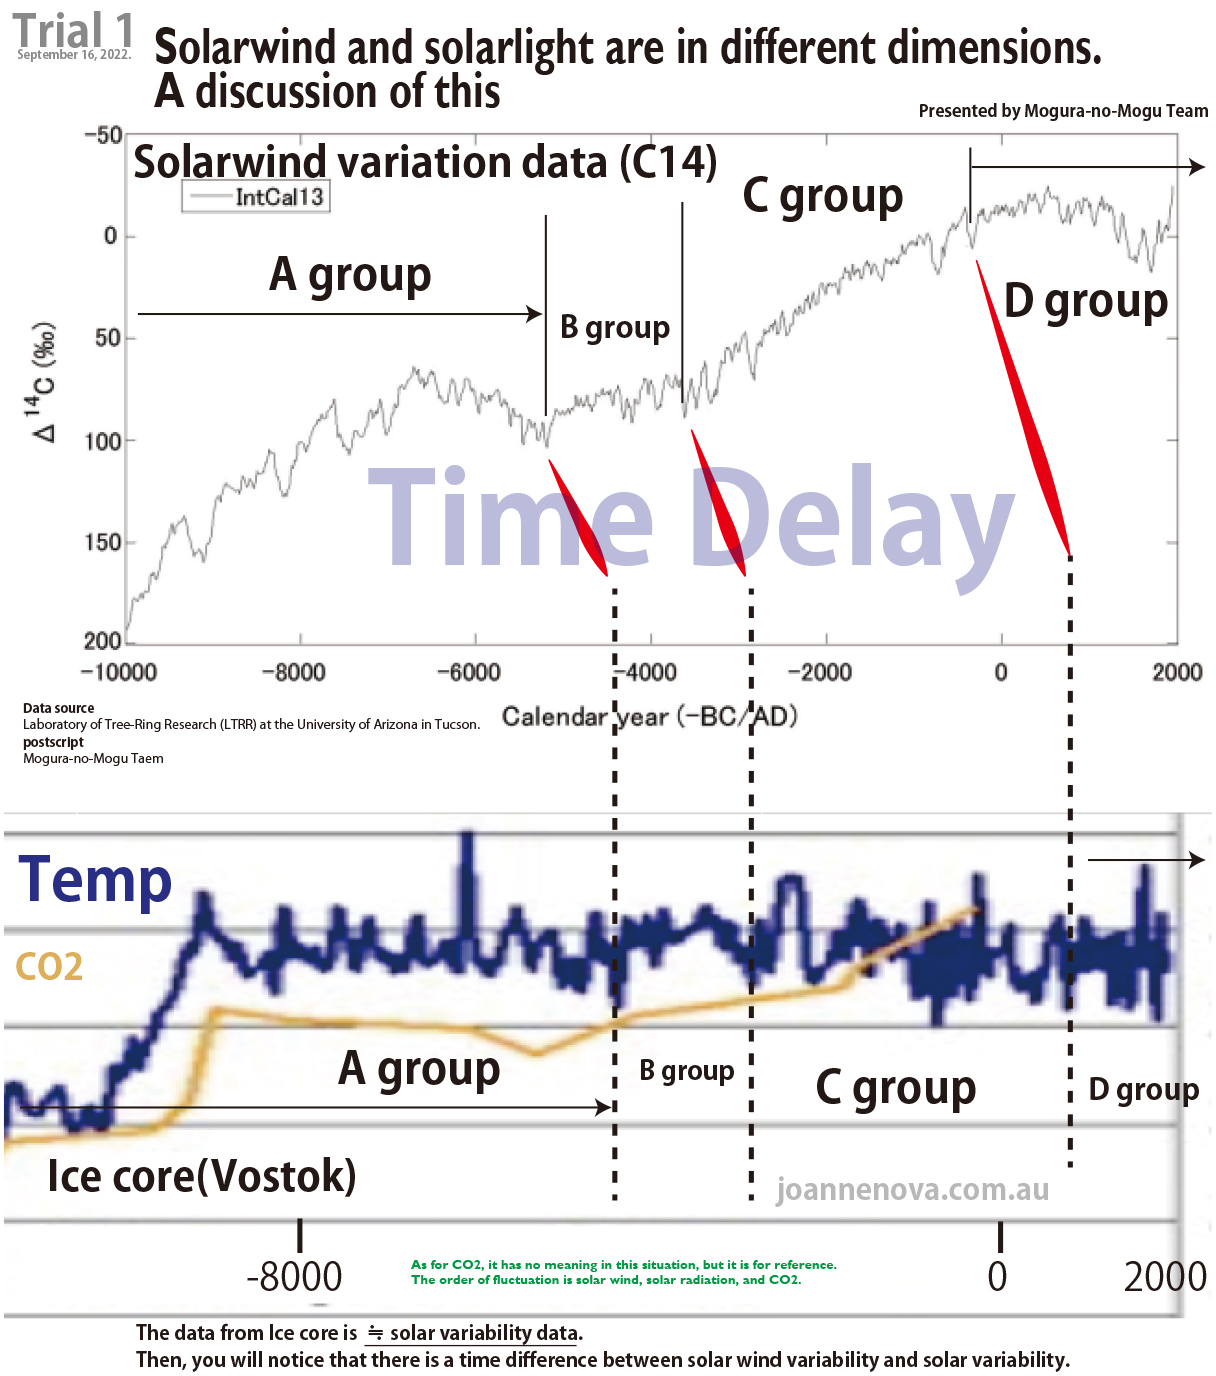
Do you understand that solar wind and sunlight must be clearly separated and understood?

Question 9.
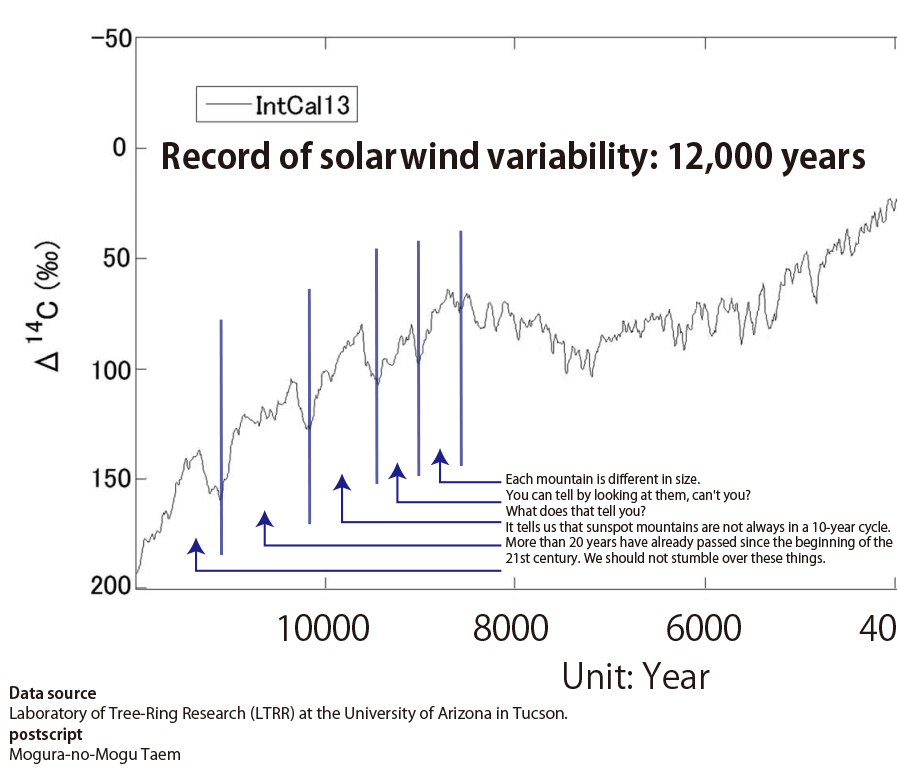
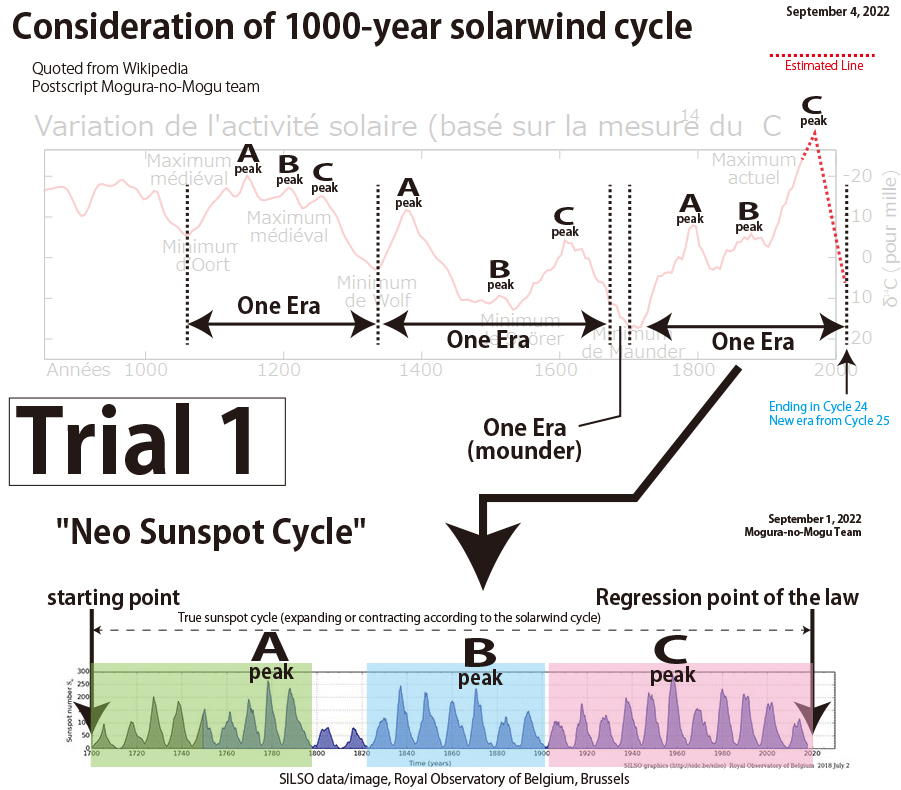
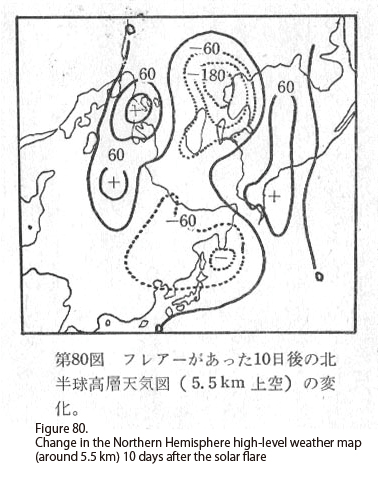
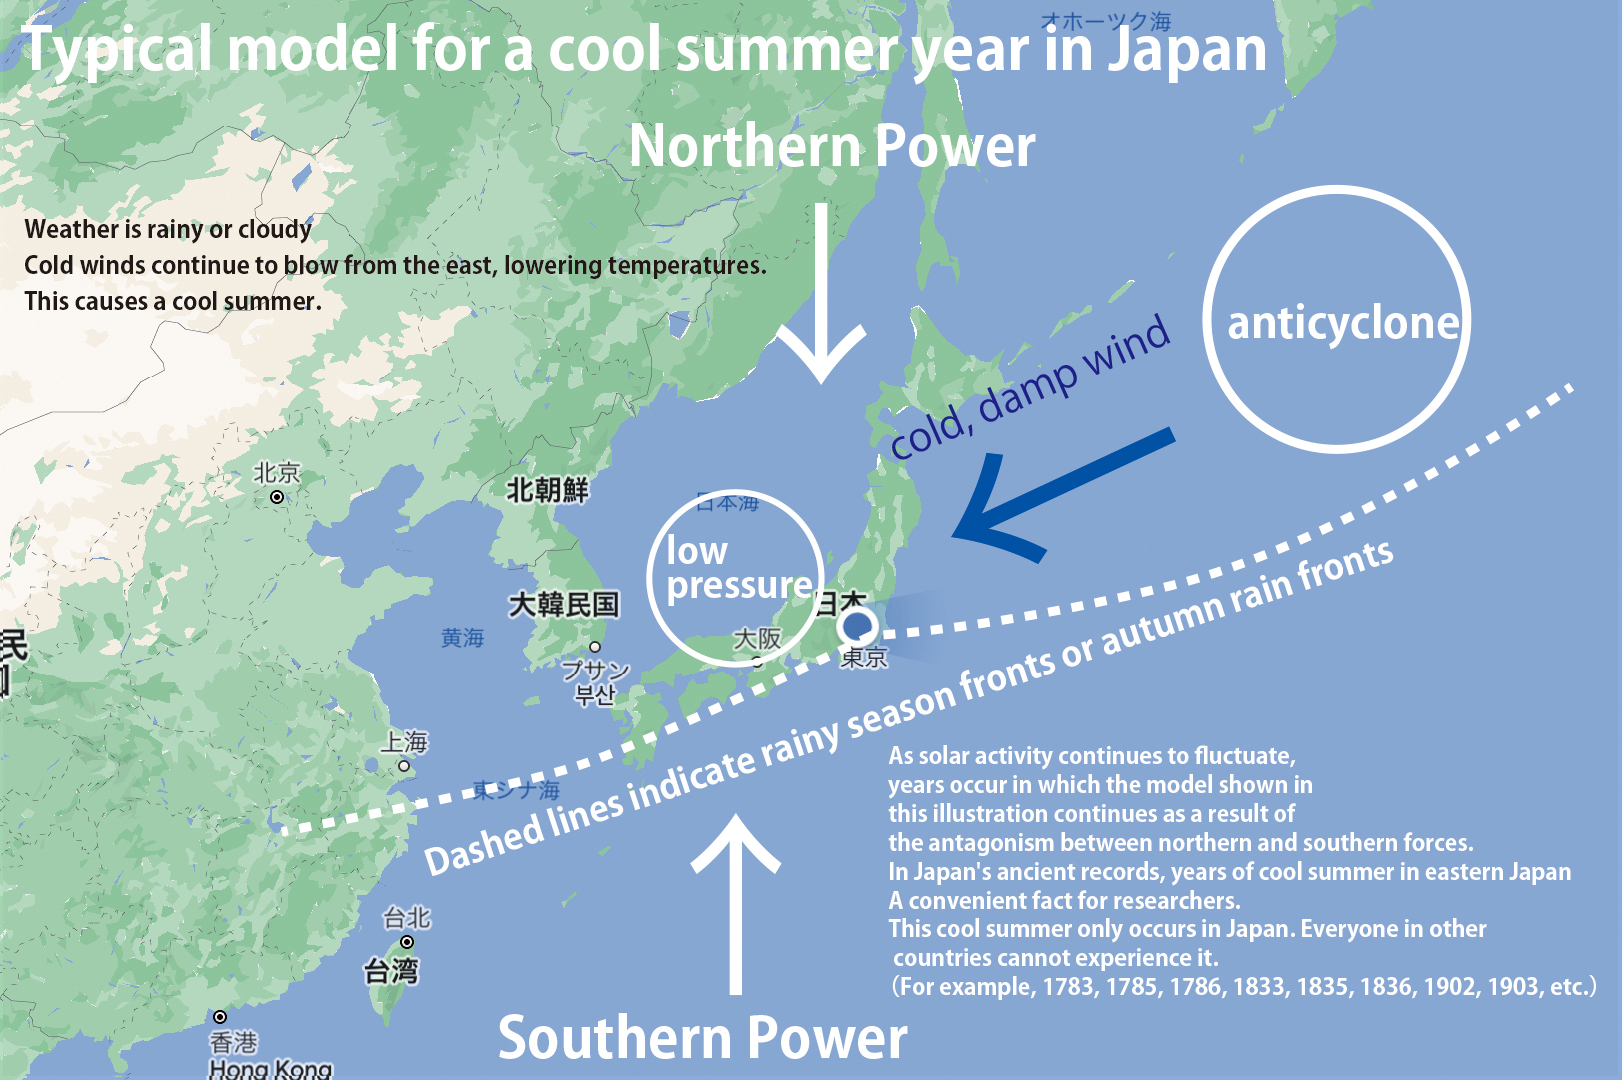
(which is difficult to disentangle completely) Did you understand that the solar wind cycle would be related to atmospheric reflux and the solarlight cycle would be related to mean temperature?

Question 10.
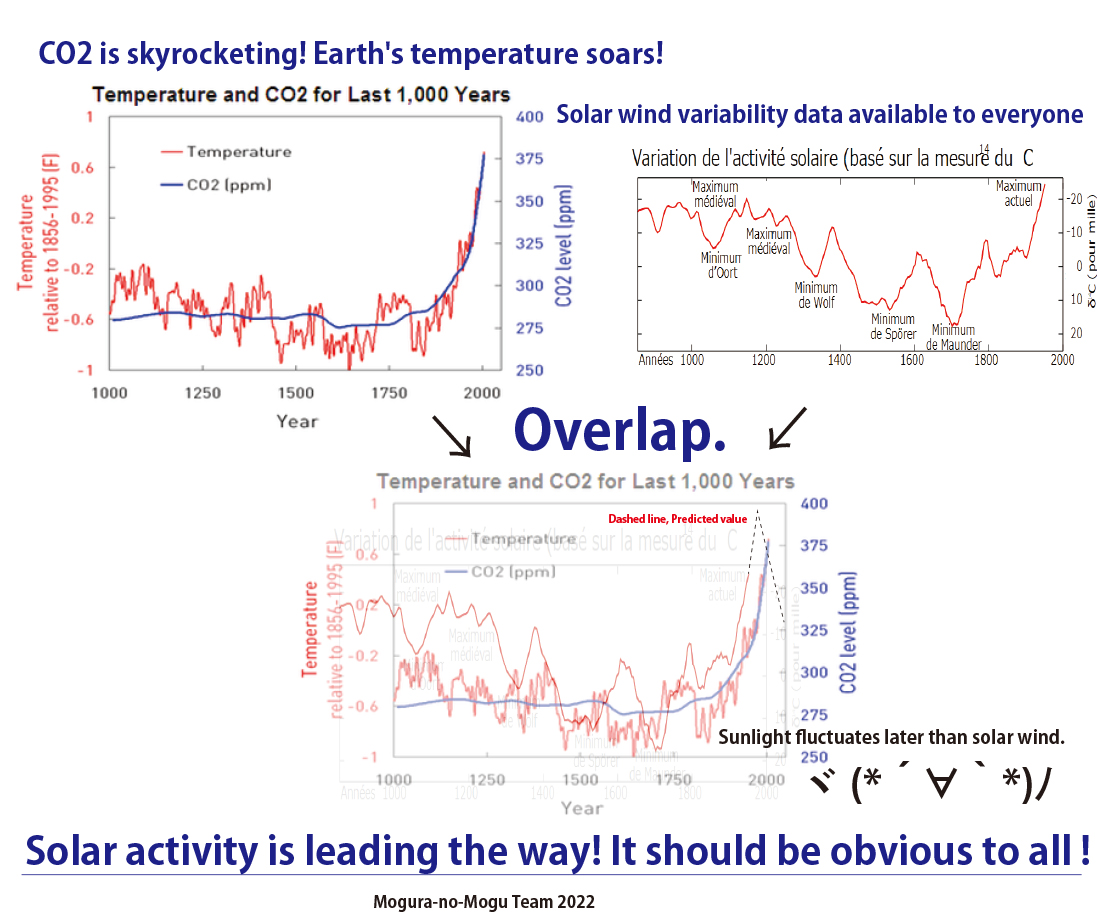
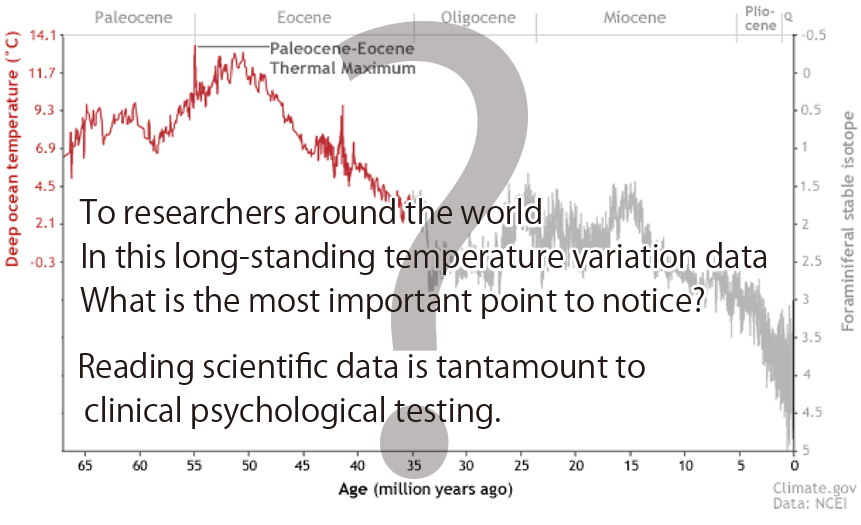
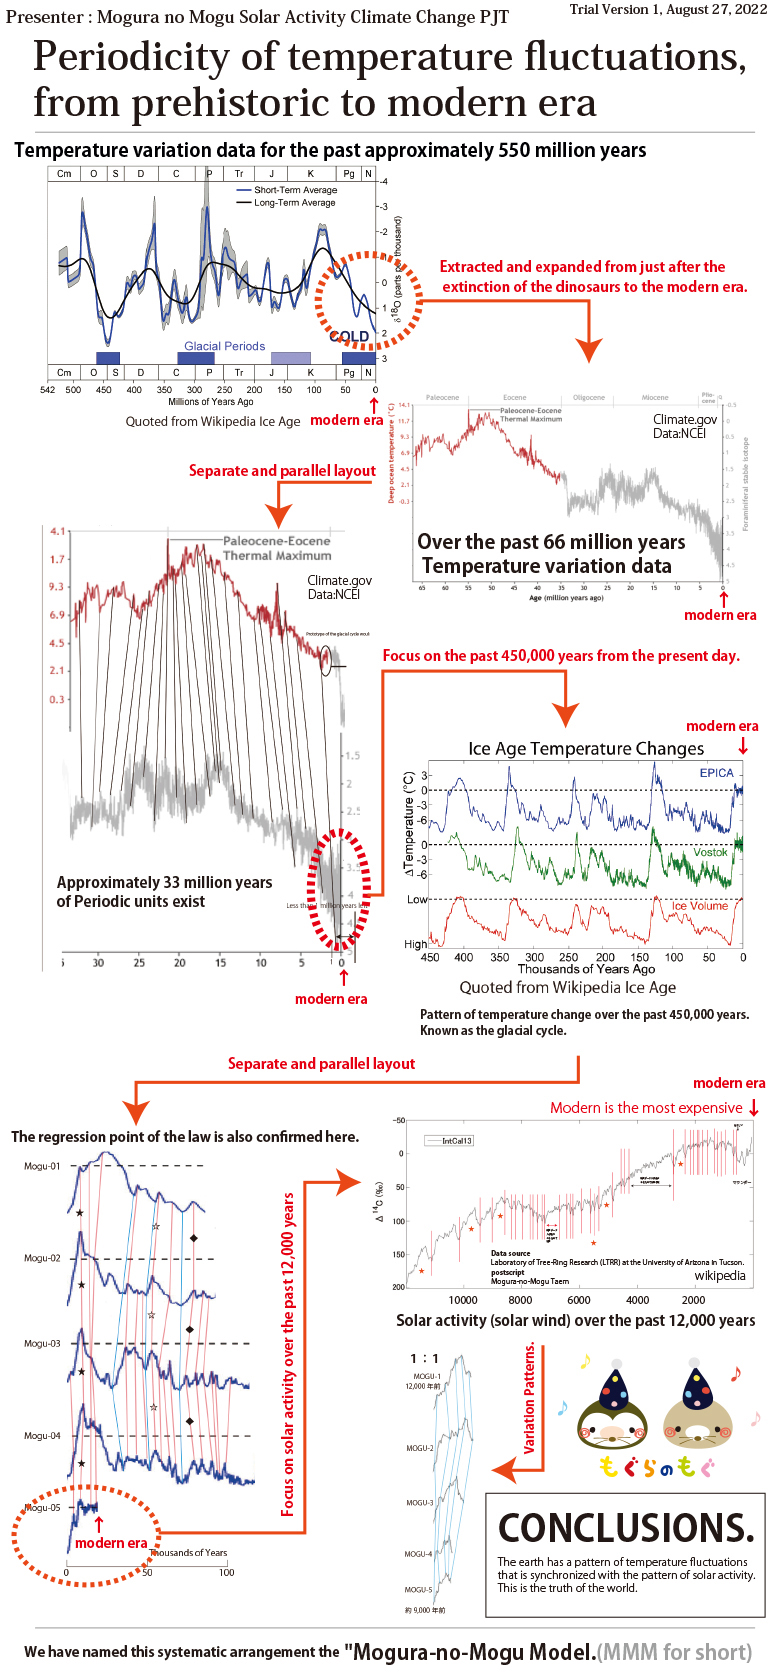
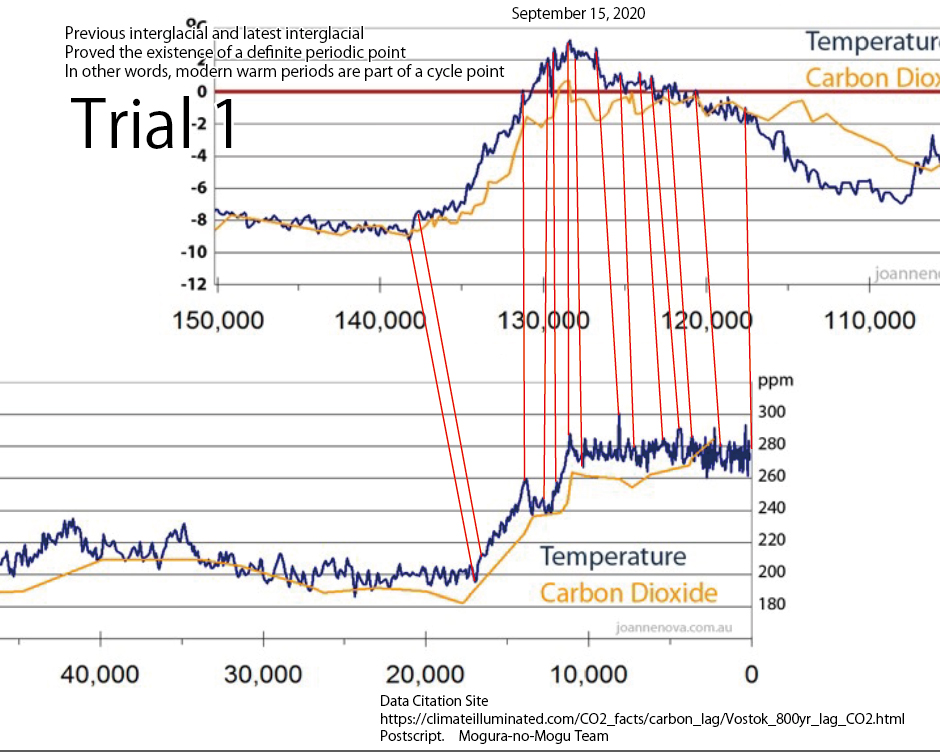
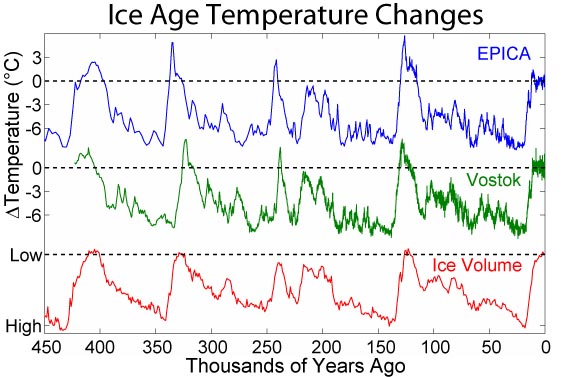
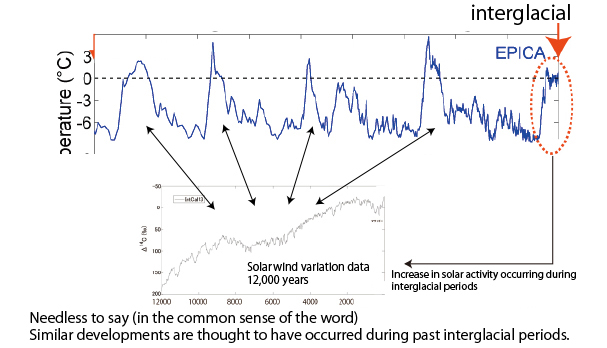
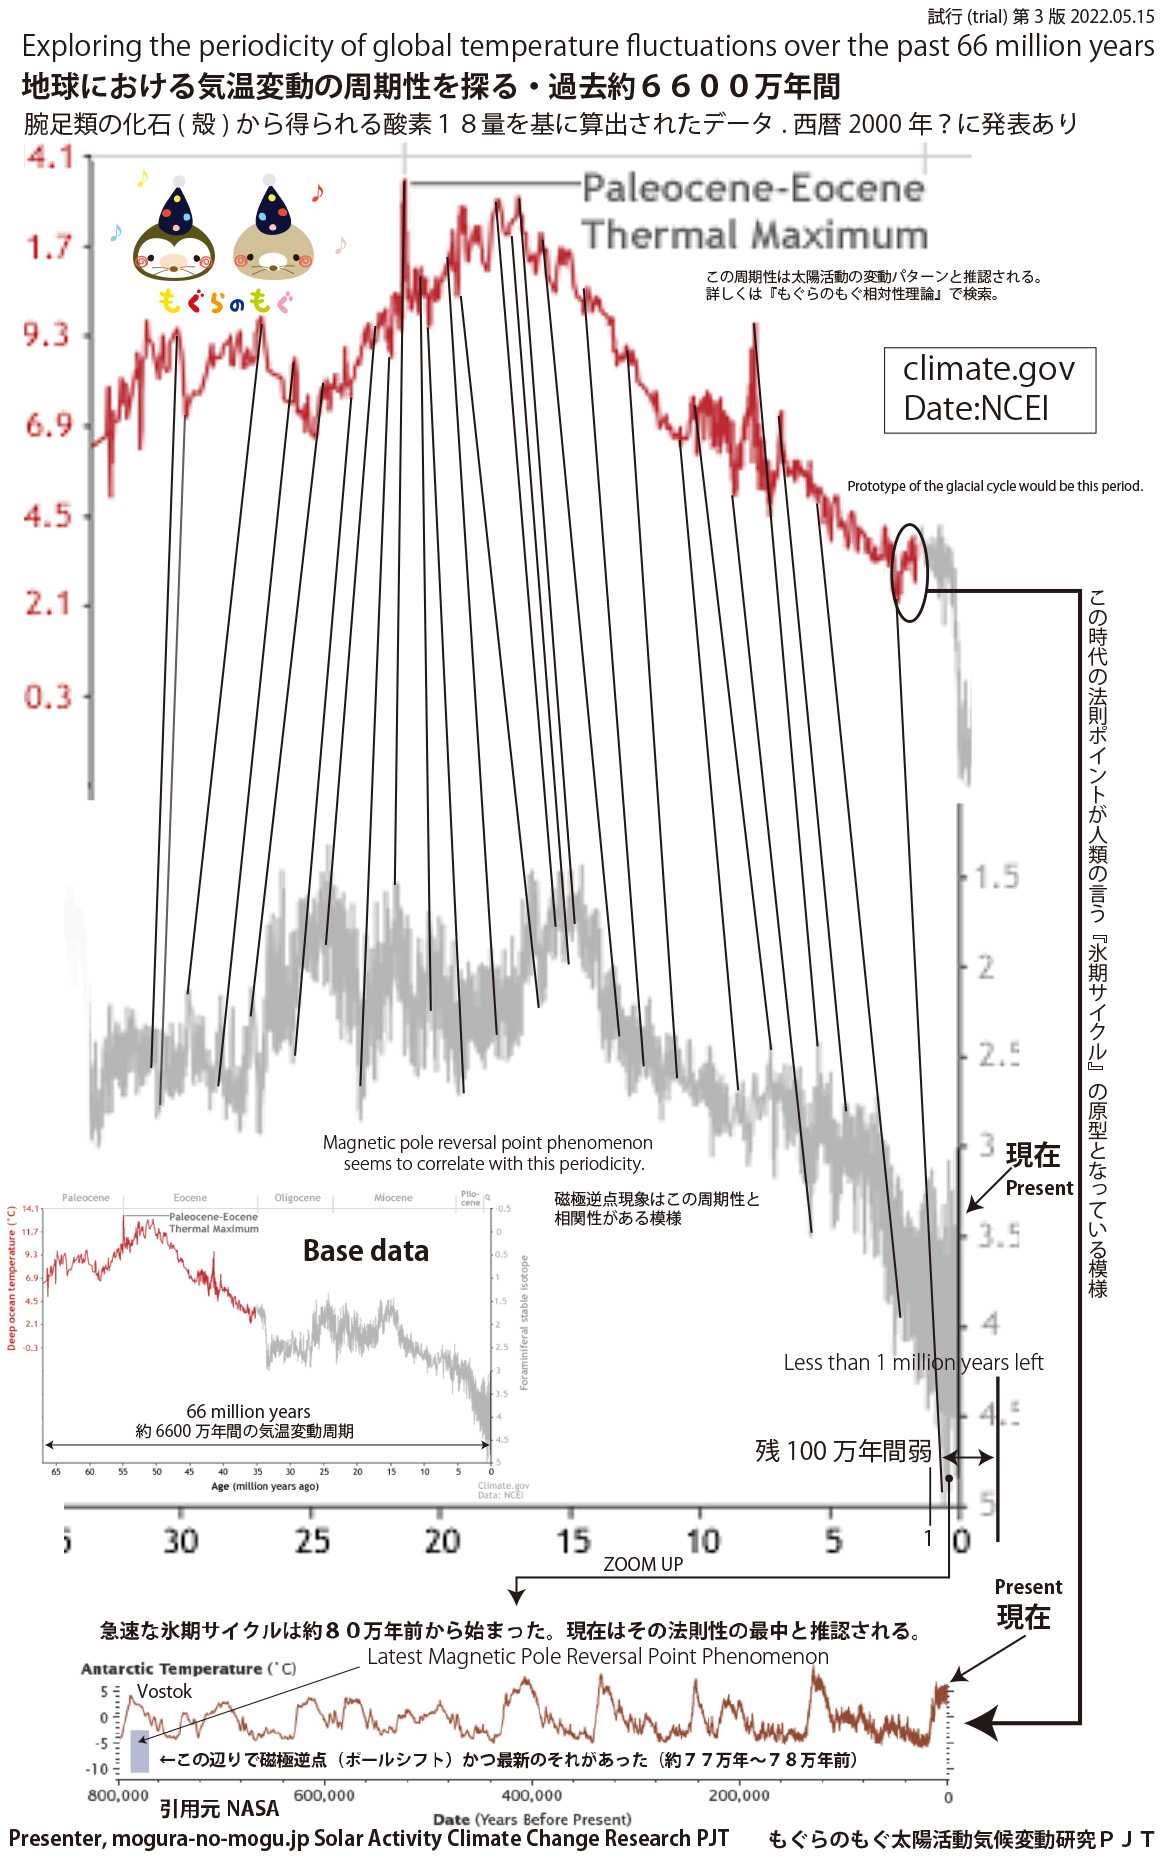
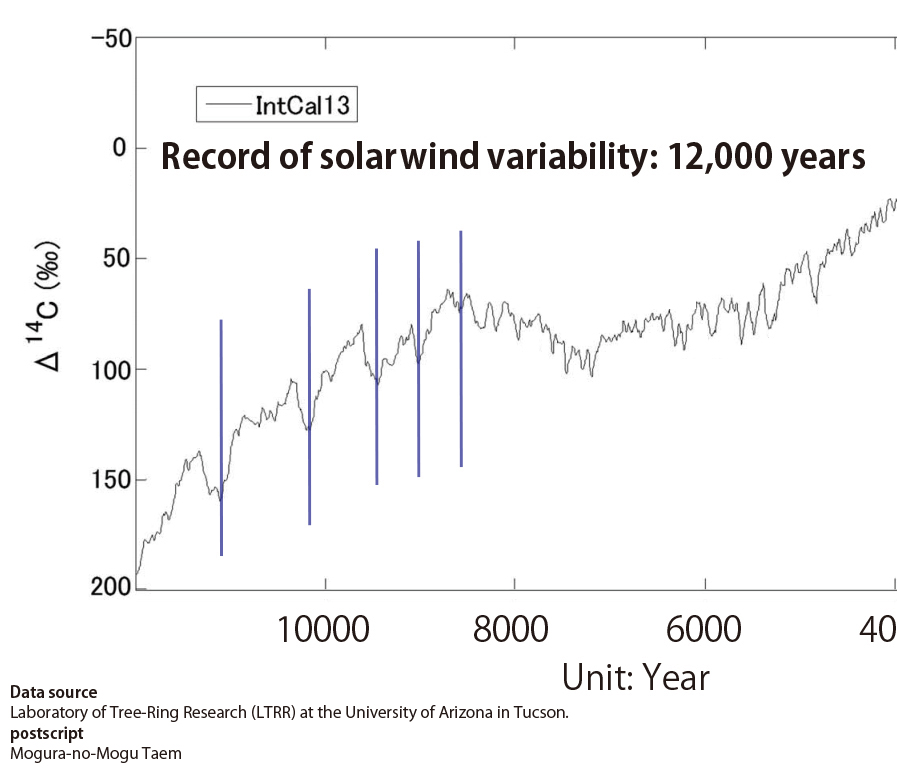
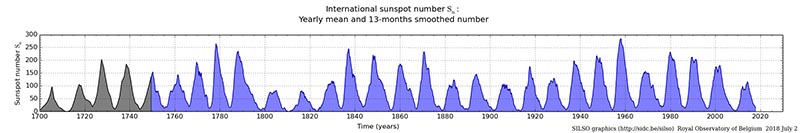
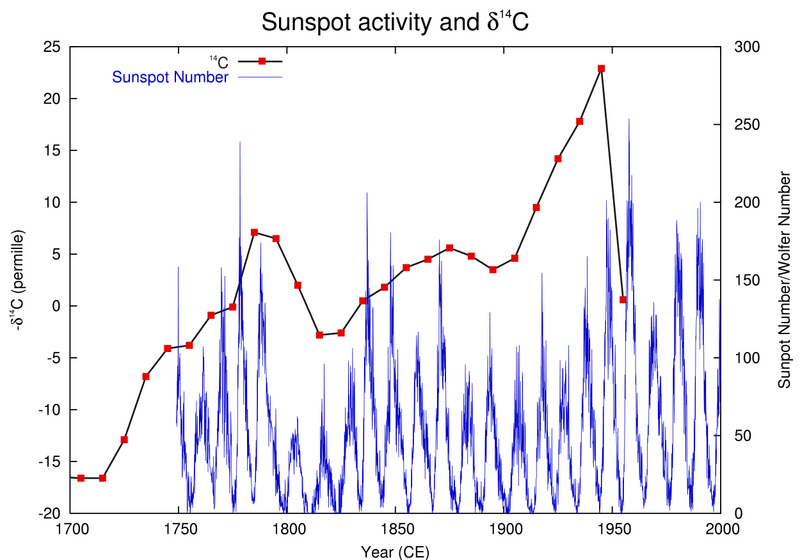
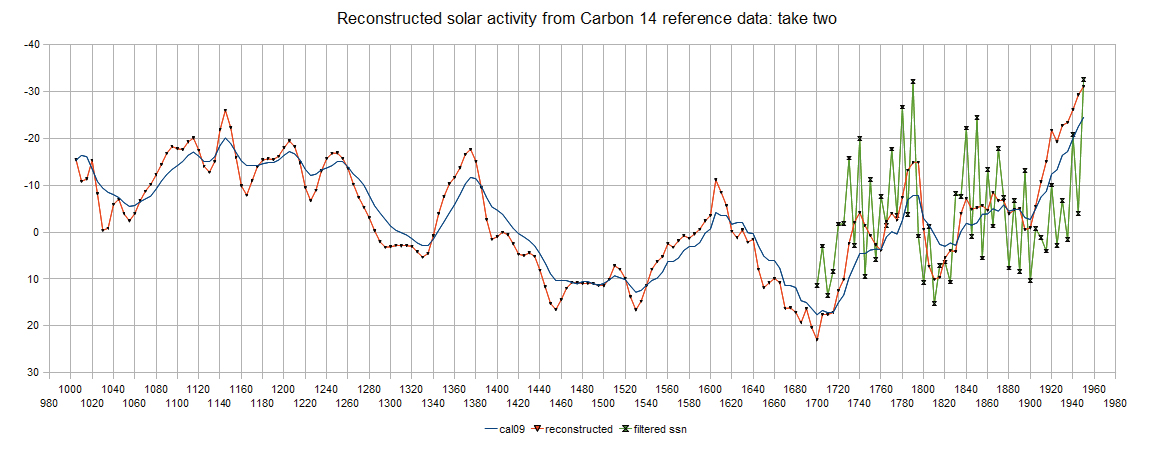
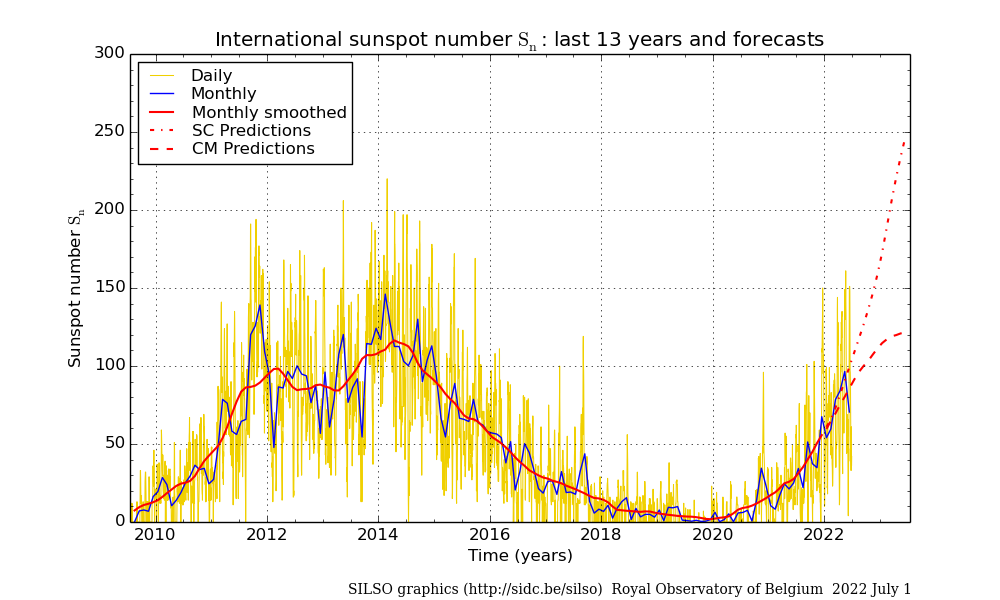
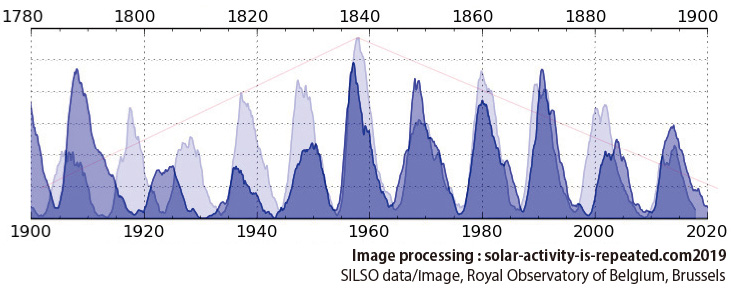
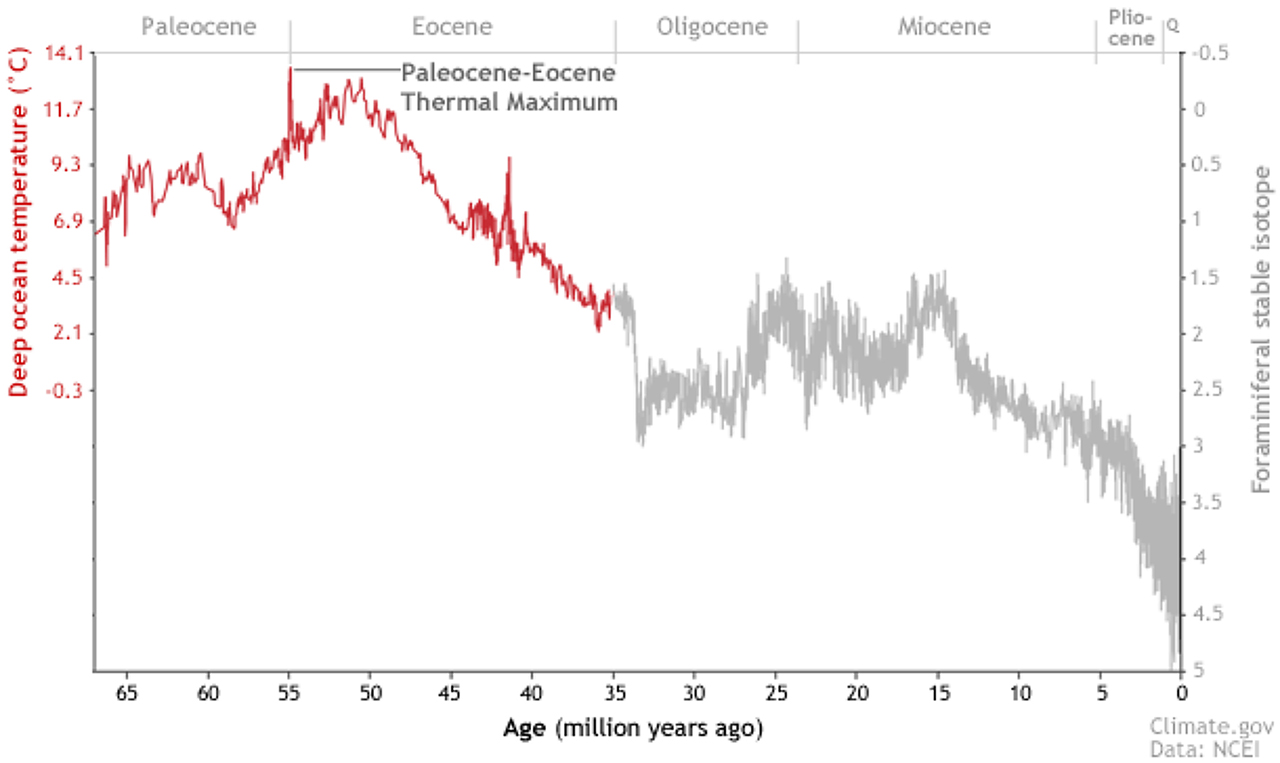
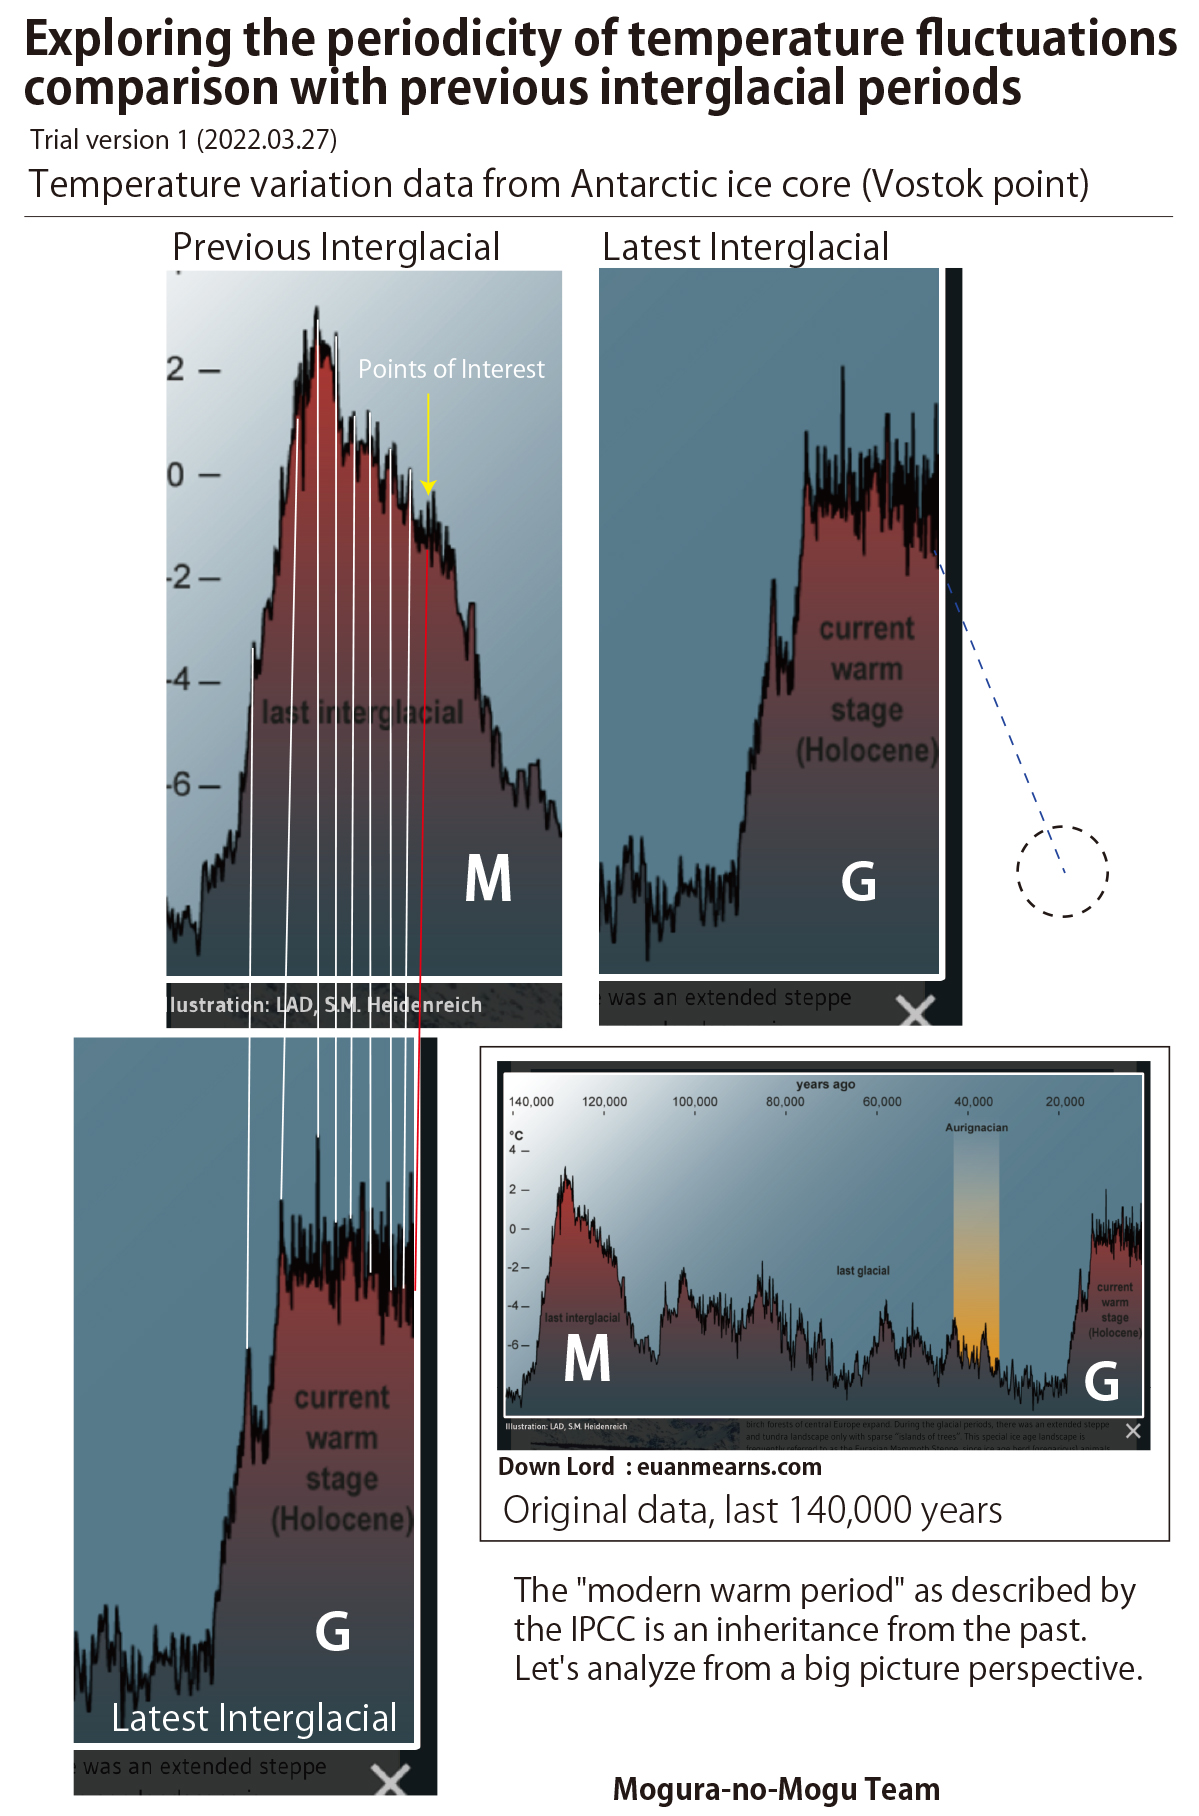
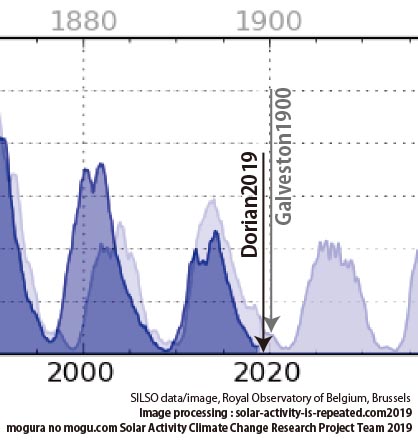
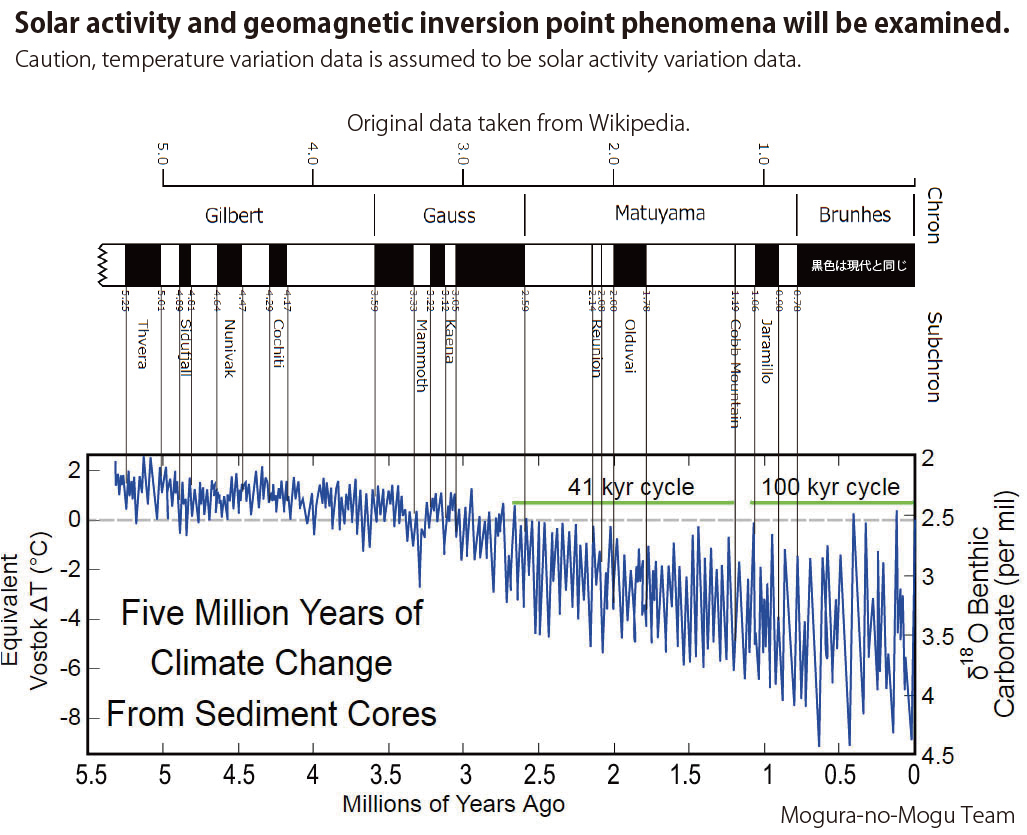
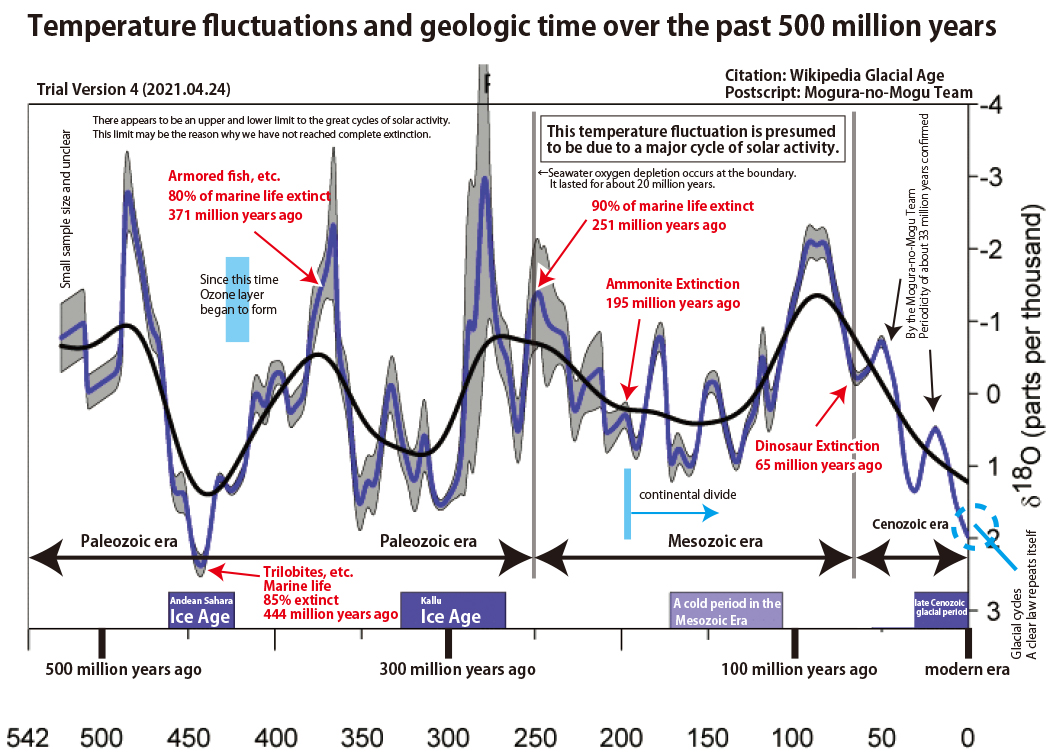
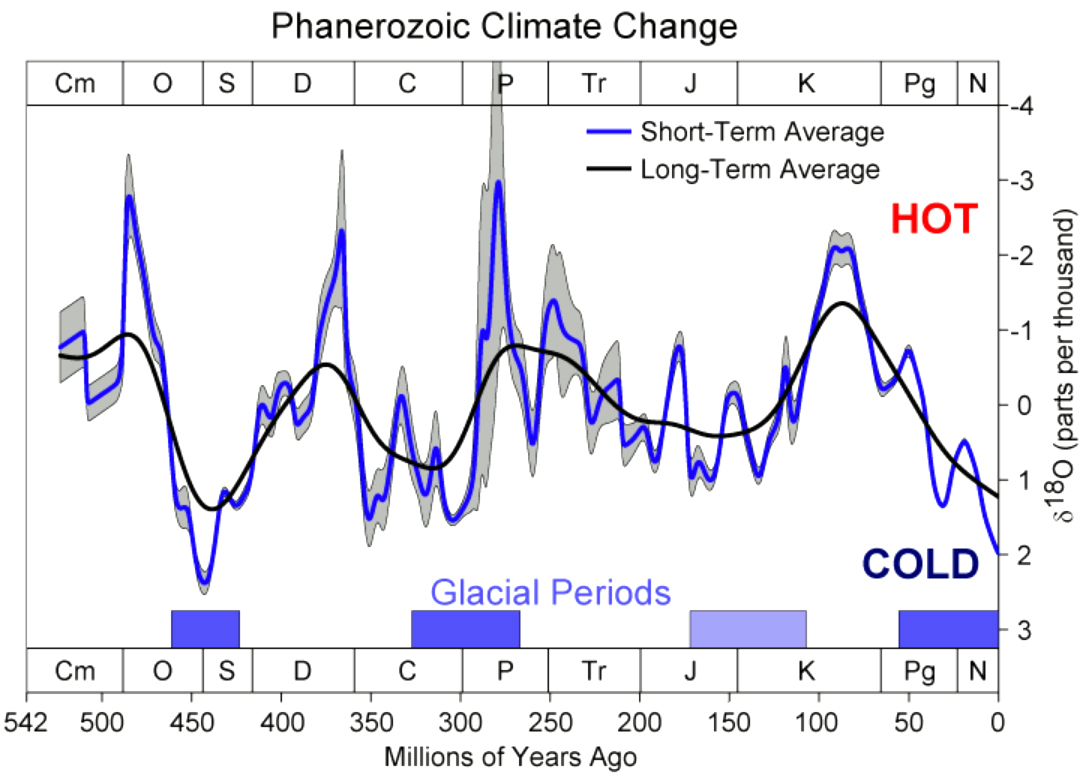
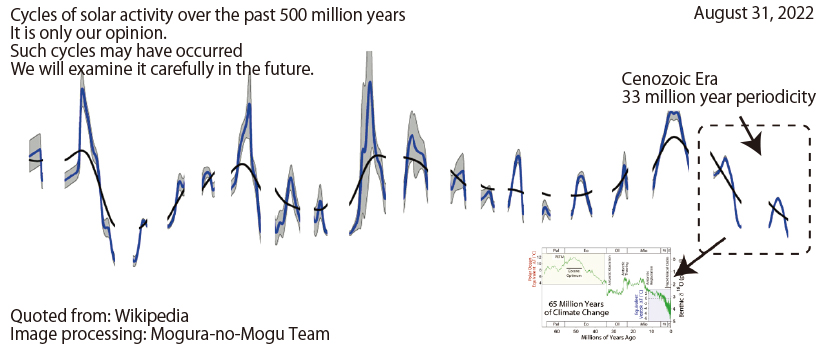
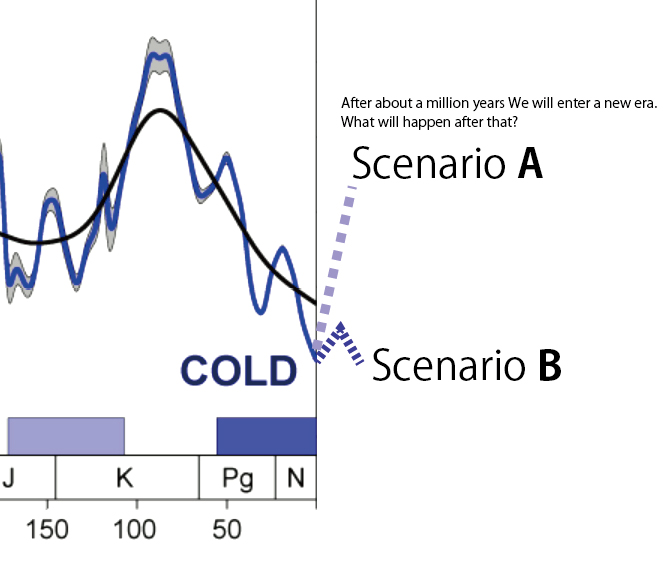
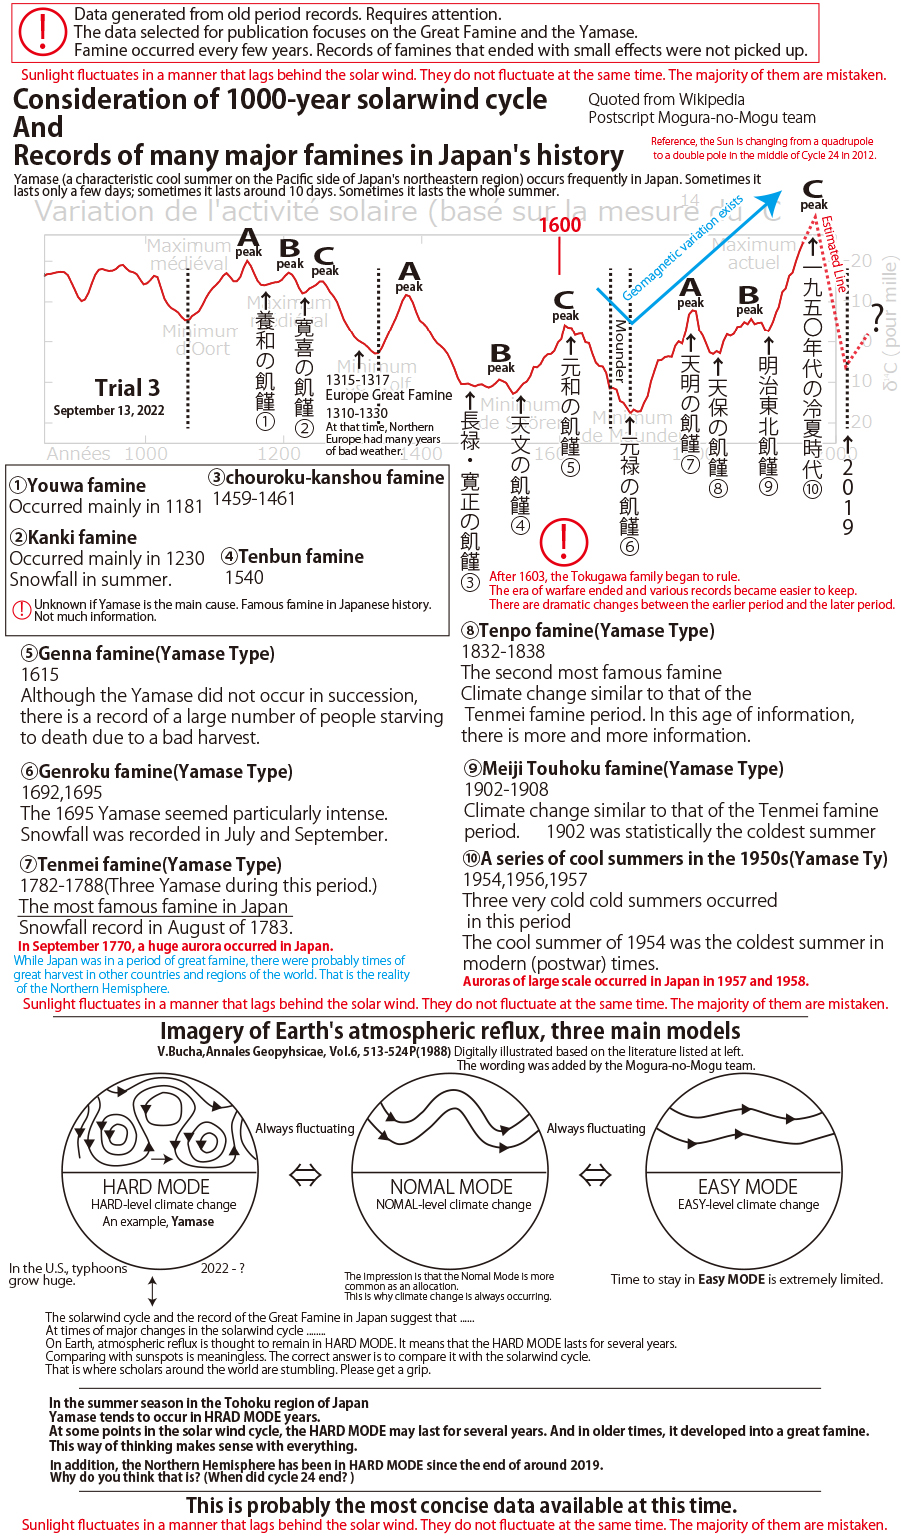
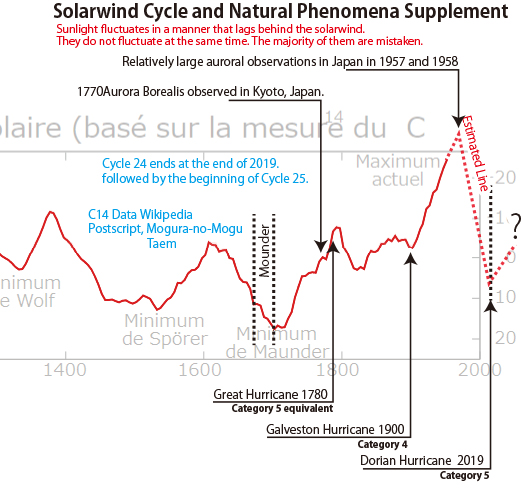
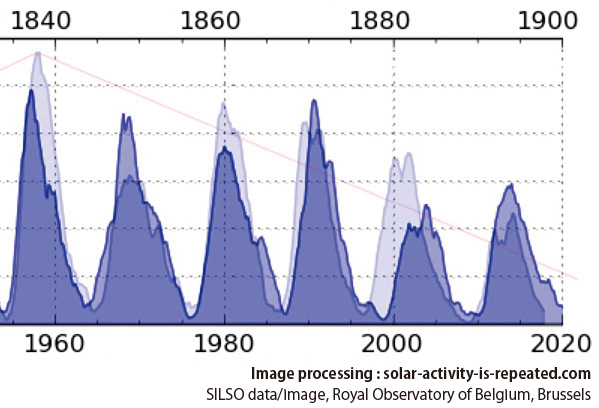
Did you understand that there was a definite periodicity in global temperature fluctuations? Did you also understand that the modern temperature increase is also in line with the periodicity? Did you also understand that it is synchronized with the periodicity of solar activity?


Evaluation Announcement

Yes Responses 10
We are finally at the starting point. We look forward to your future success.

Yes Responses 9
We had reached a close point. However, We still need to study more. You should better understand the explanations of Professor Papa-mogu and Dr. Kaeru-san.

Yes Responses 8-6
Failure is confirmed. However, there is a chance to start over. It is up to you.

Yes Responses 5 or below
Unfortunately, you are not suited for work in this field. However, if you get a job at IPCC, you will be a competent employee. If you are published a skeptical book or a denial site, you should pretend not to see or hear it, and stubbornly continue to defend your own theory.

This is a rather harsh assessment, but climate change research is an area that should be tackled by scouring the best and brightest and selecting even more talented people from among them.
It is the most difficult subject in the world. It is not a job for the naive.


Which understanding is more scientific?

You may want to compare and contrast our presentation with that of the websites listed below.
It is a world of difference between the typical understanding of the previous era and a carefully considered understanding of the very basics.

https://www.climate.gov/news-features/understanding-climate/climate-change-incoming-sunlight

From our point of view, the previous era's understanding seems childish.